Using the Table node to display data
What you will learn in this guide
In this guide we will walk you through how to use the Table node and get it to display data that is retrieved from a Query Records node.
Create new project and import the Table
Create a new project in Noodl using the Hello World template. Create a new Noodl Cloud Service by following this guide. Once you have the backend, create a new class called Parks, and add the following columns (name, type):
- Image_src, String
- Name, String
- State, String
- Desc, String
- Size_km2, Number
- Established, Date
Then follow the Importing and exporting data guide to import the data from the following csv-file.
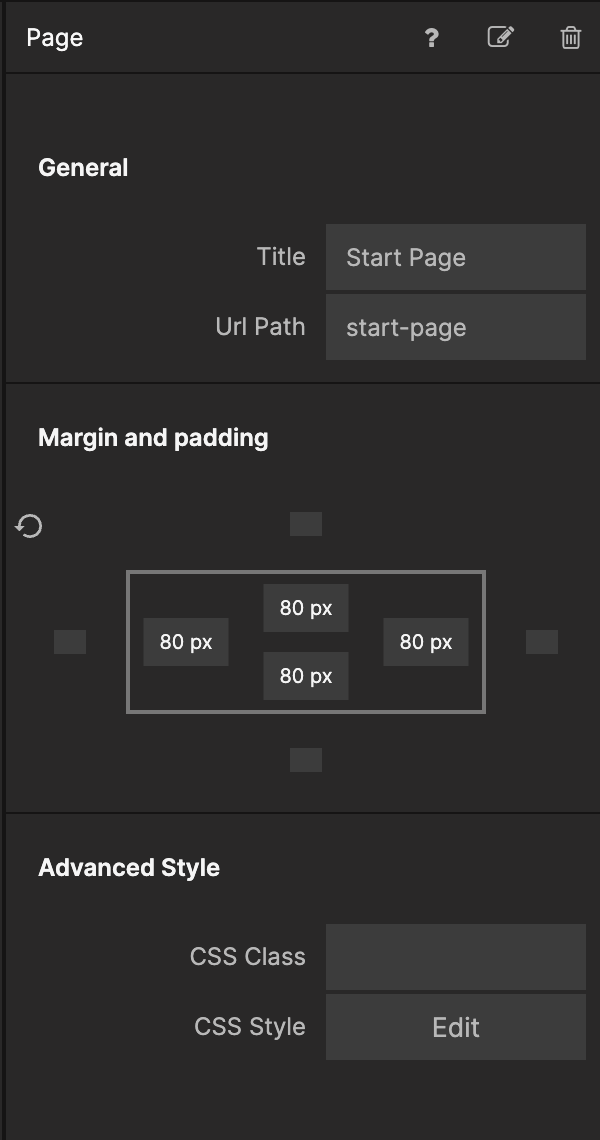
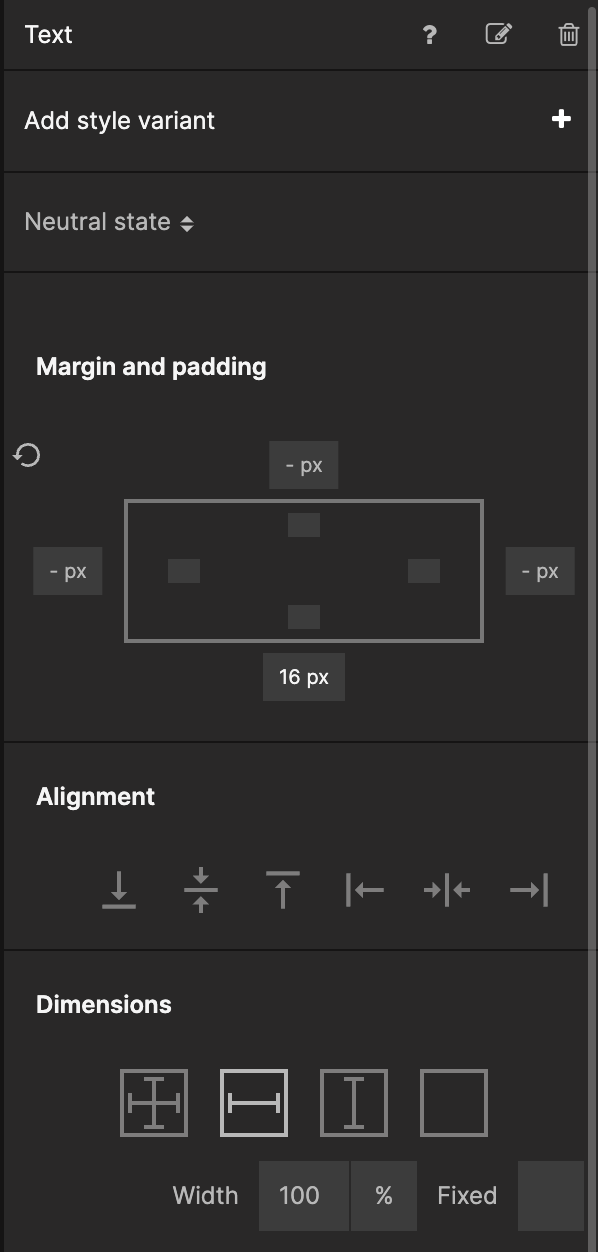
Select the Start Page component and remove the text node. Then on the Page node, add 80px padding all around.
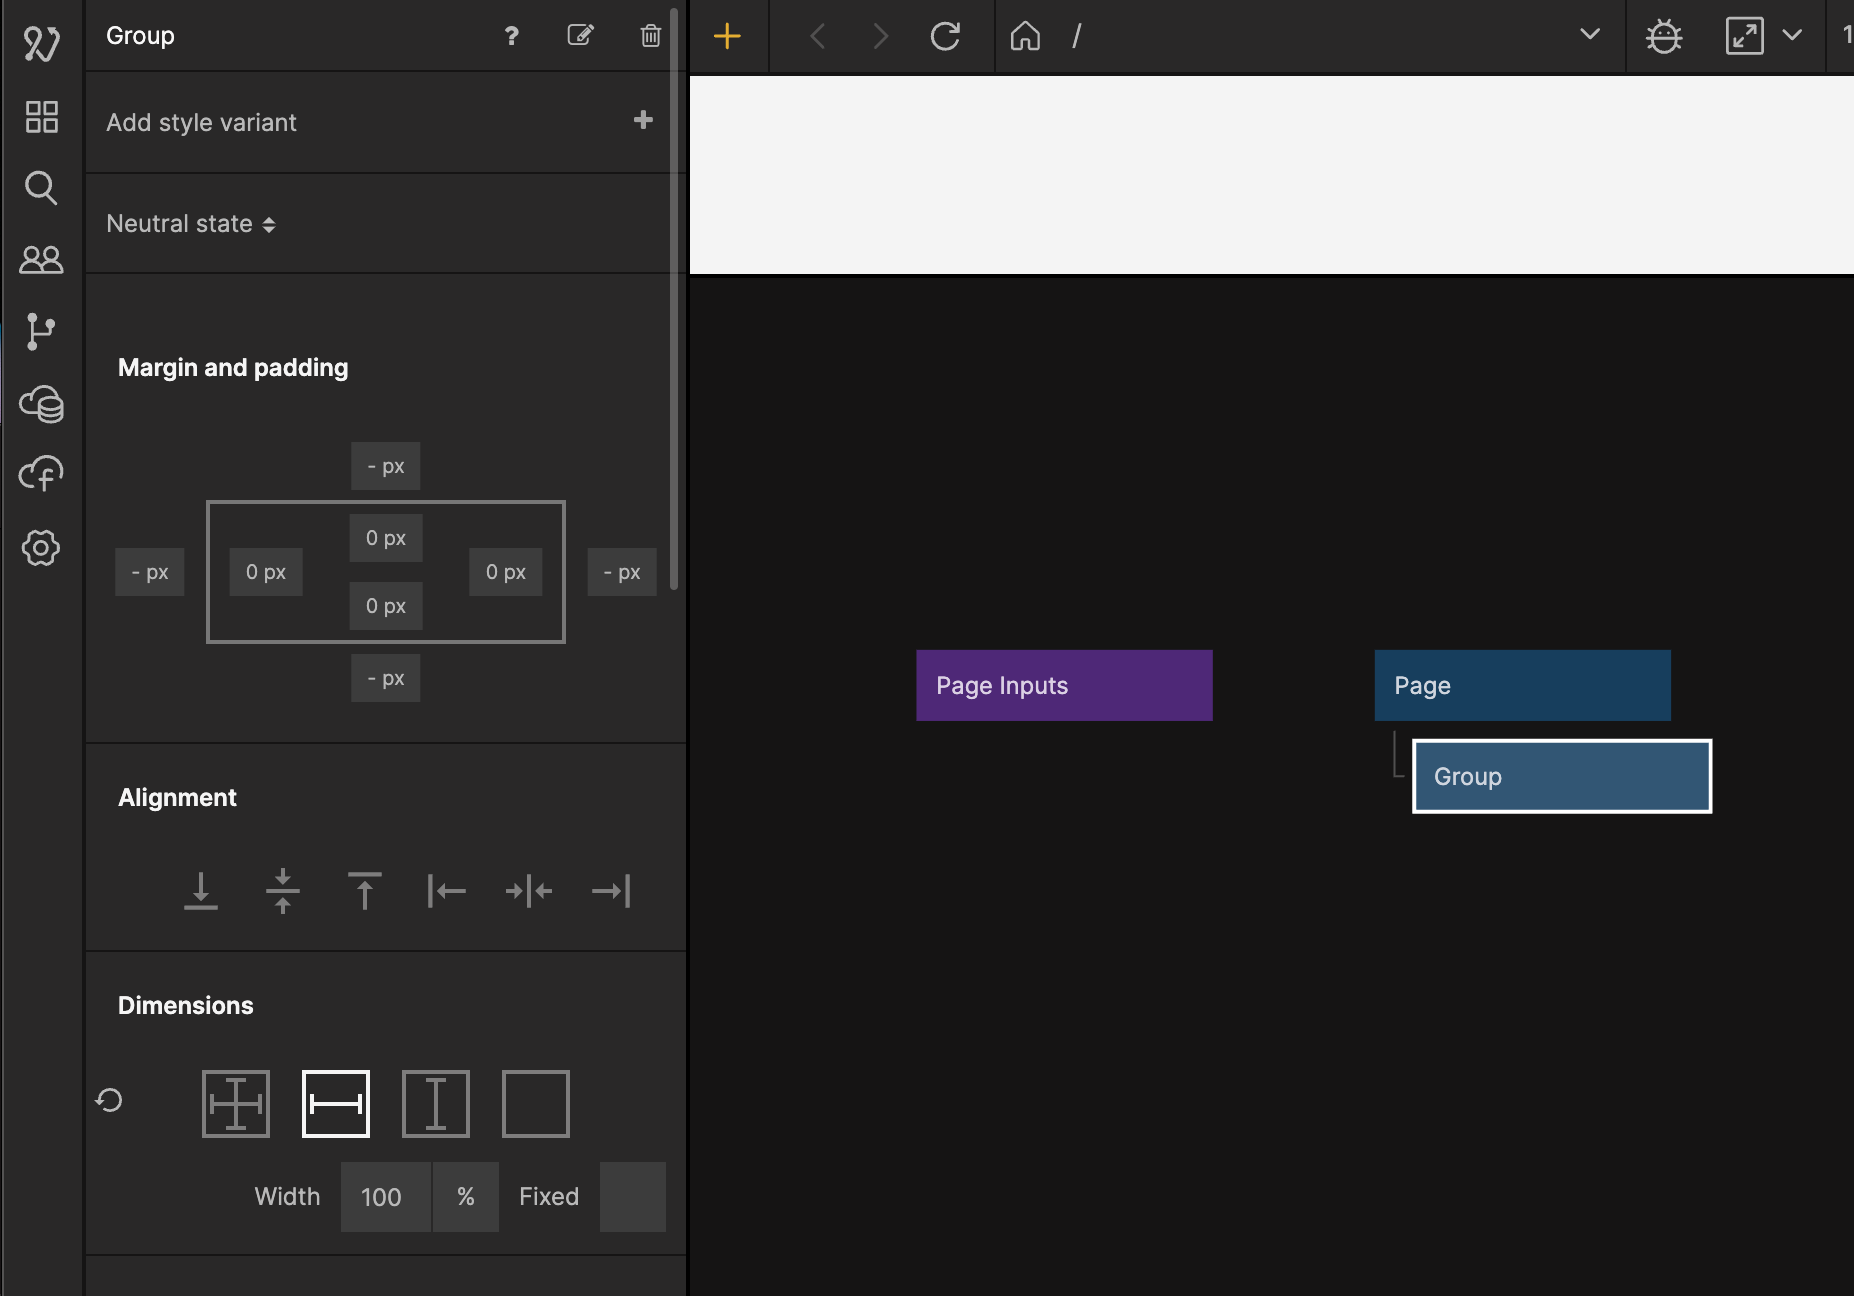
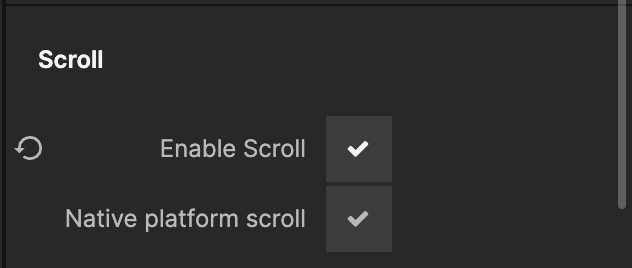
Add a Group as a child to the Page and set the Group's Dimension property to be 100% width and the children's height. You can also enable scroll on this Group. This ensures that you can scroll the Table horizontally if it is large.
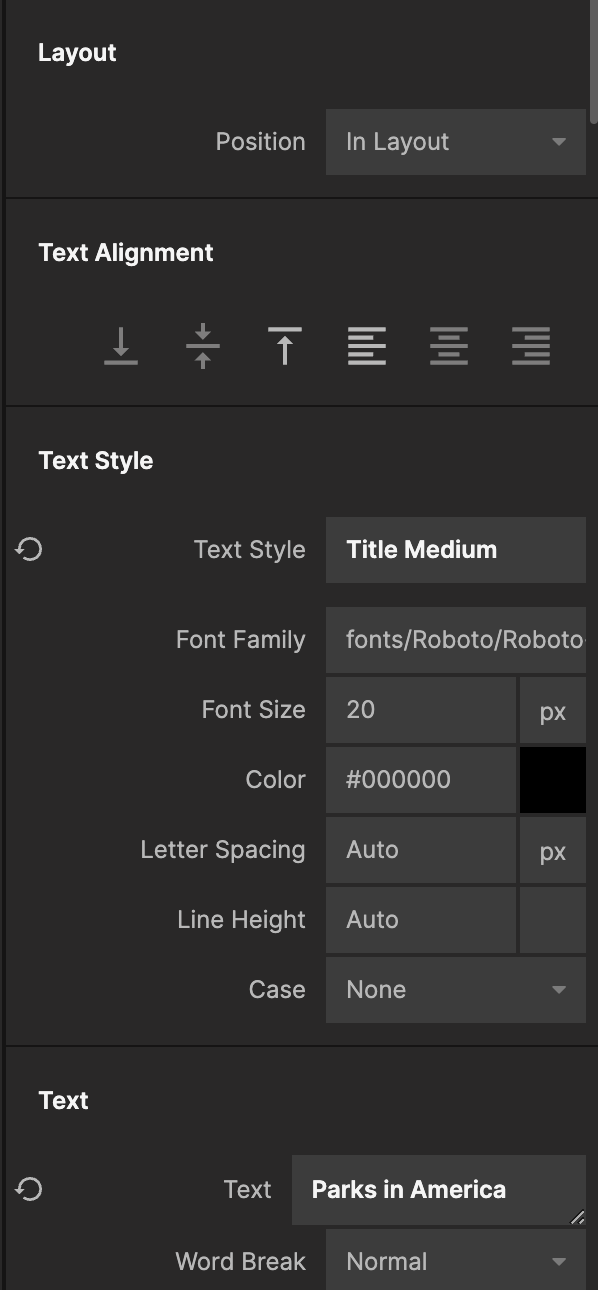
Let's also add a Text node like this:
Style the Text node like this and have it say Parks in America:
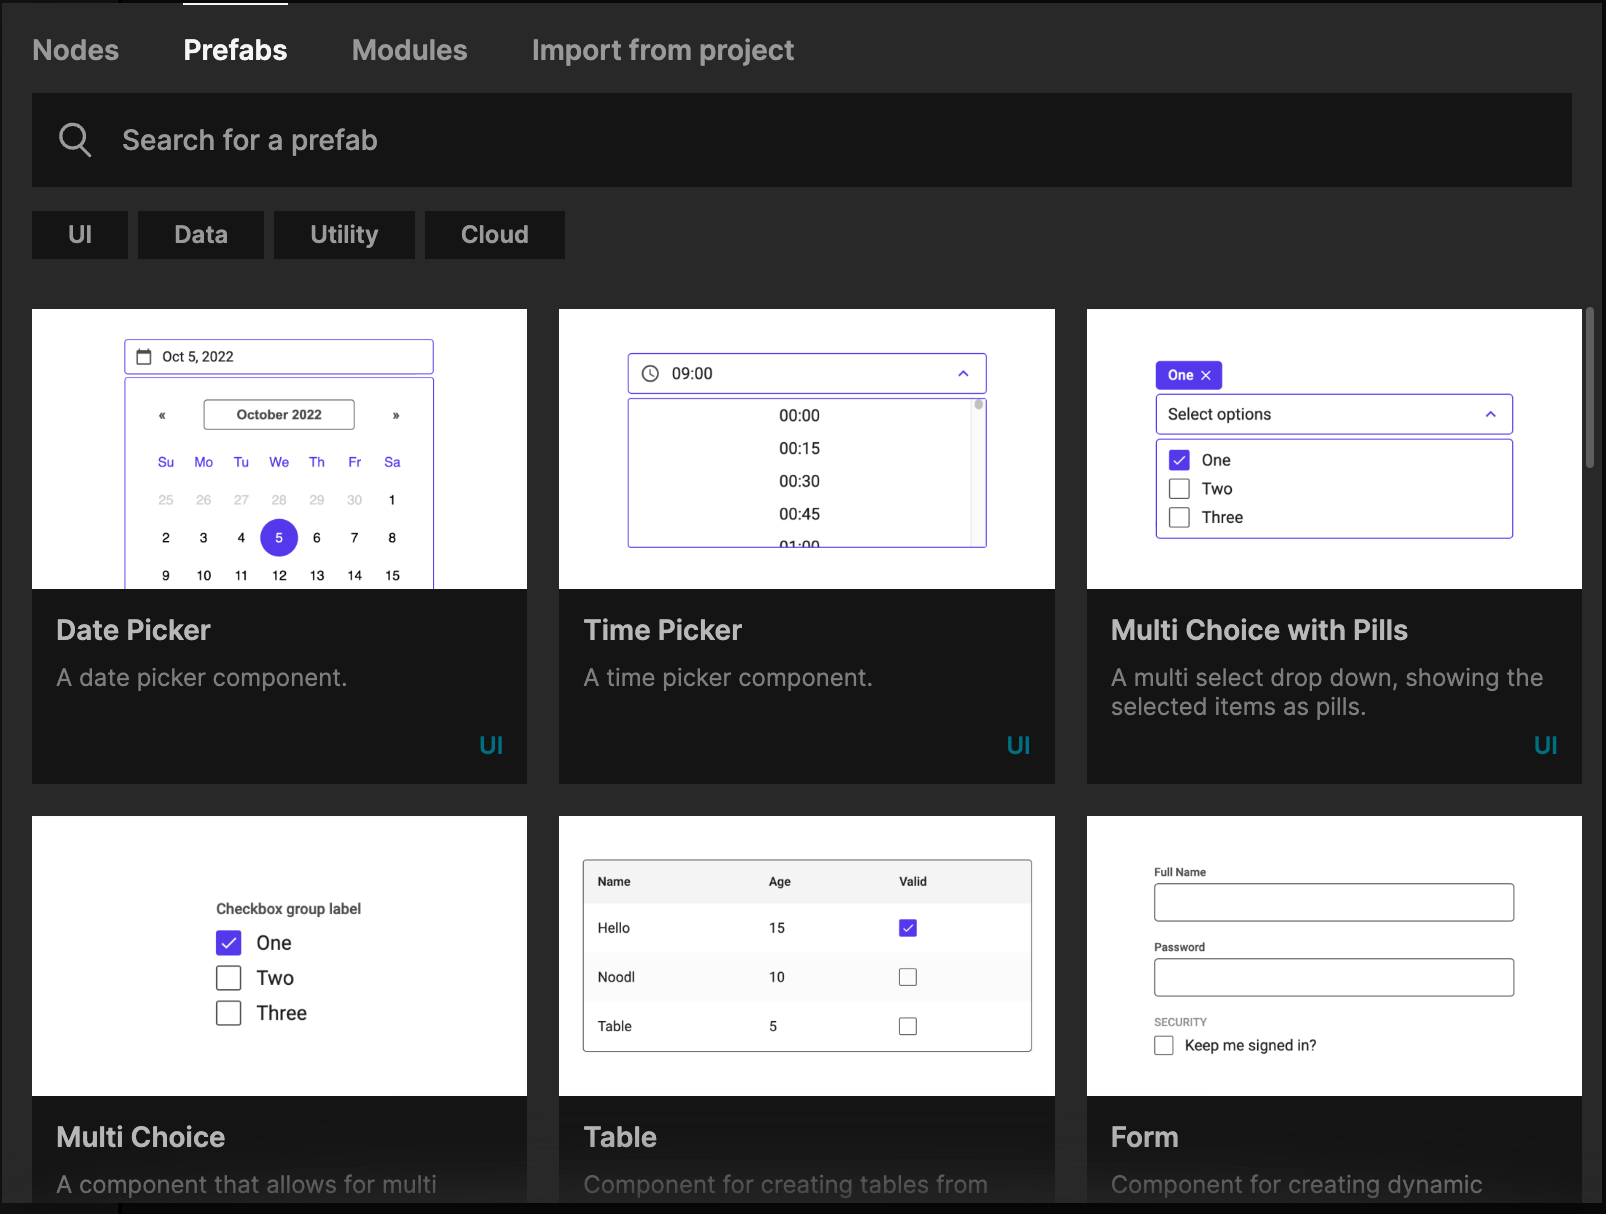
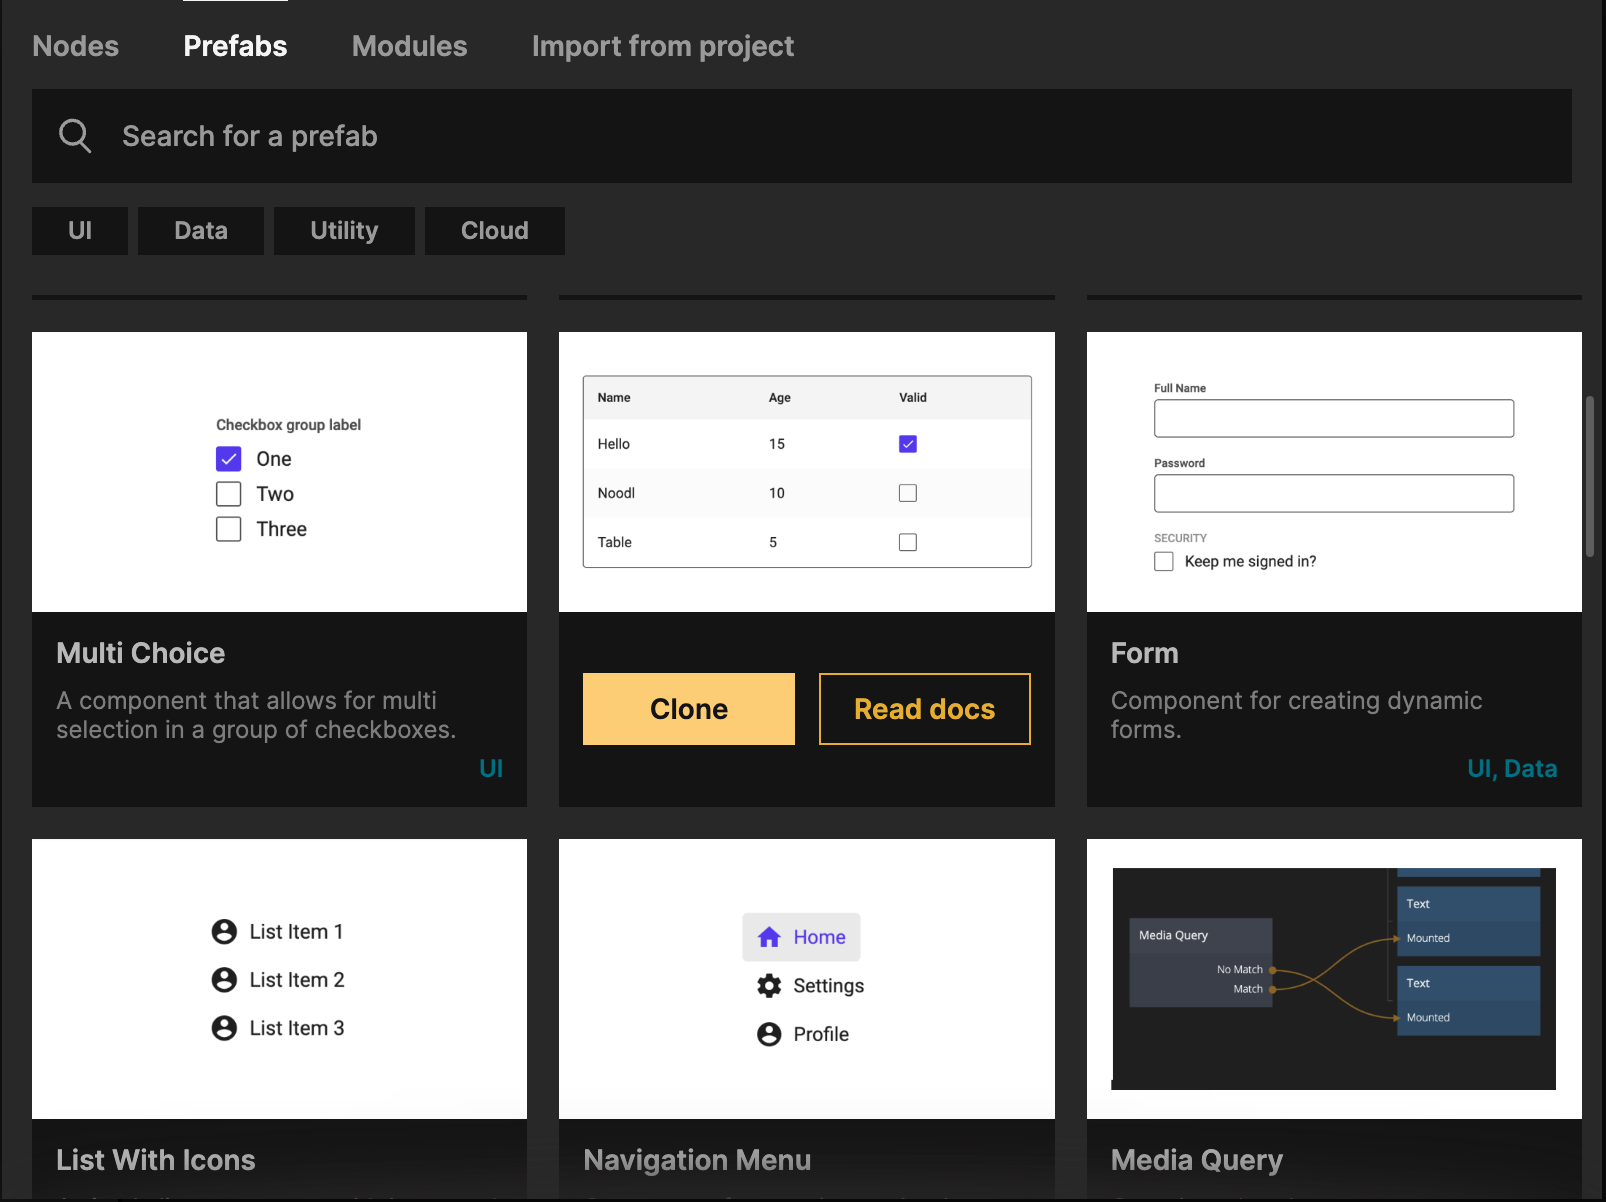
Next, in the Start Page, bring up the Node Picker and select the Prefabs tab. Find the Table prefab, and click Clone.
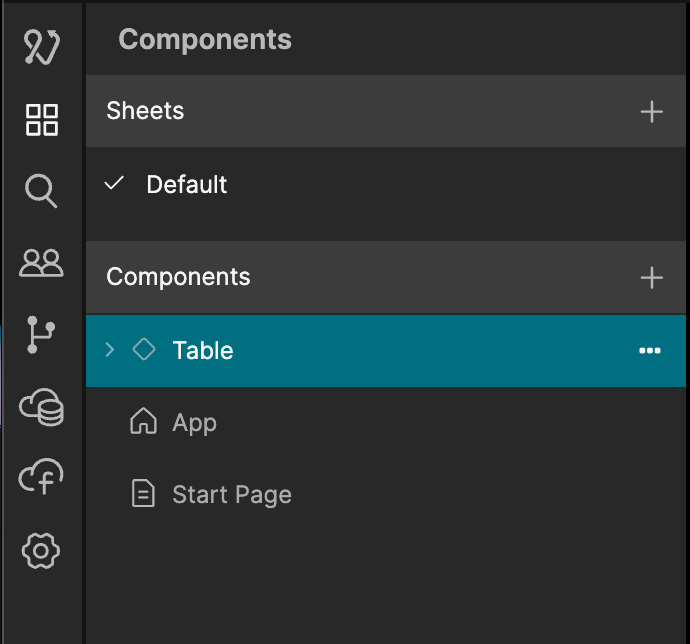
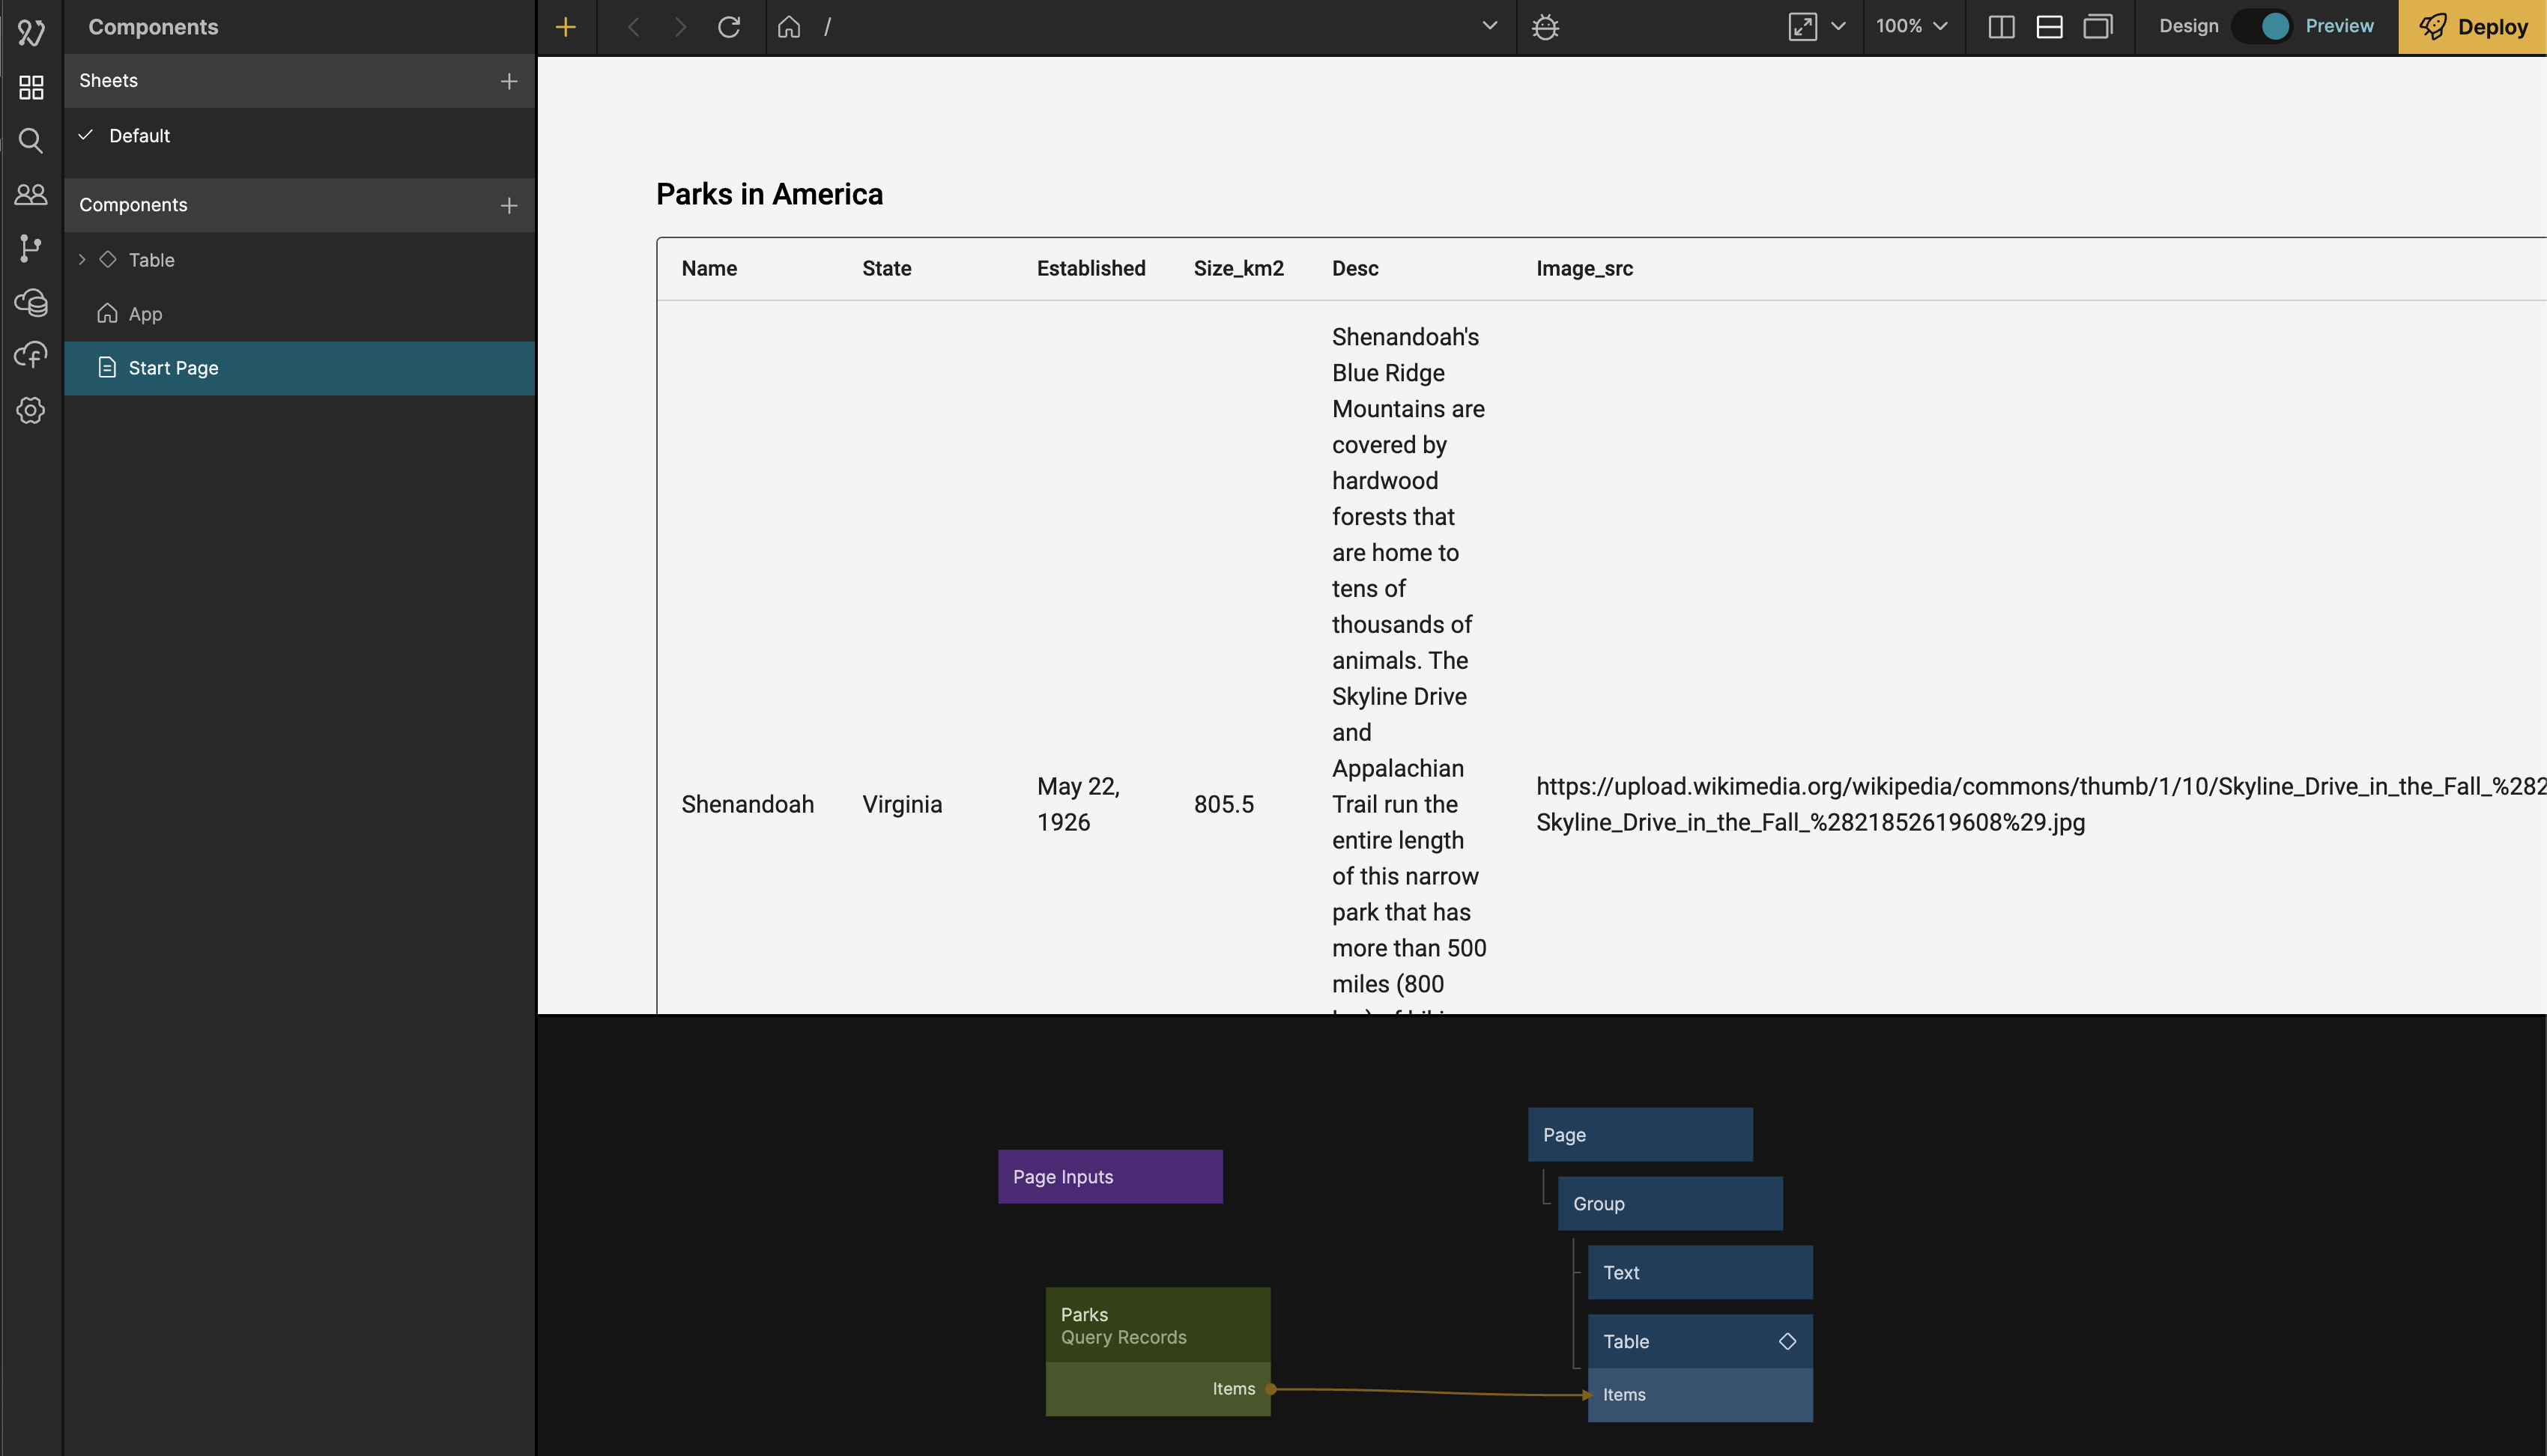
Now you should see that you have a Table component in your Components View.
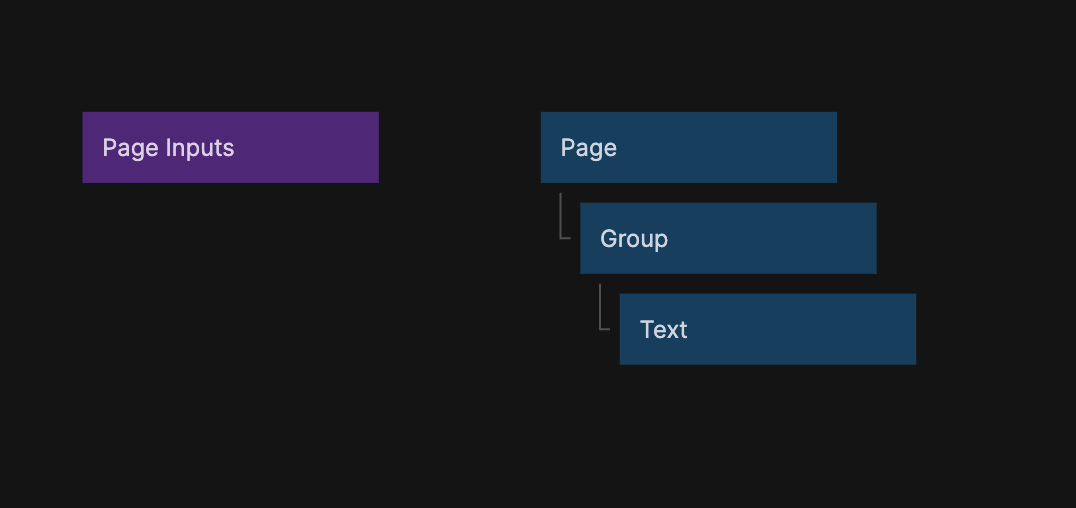
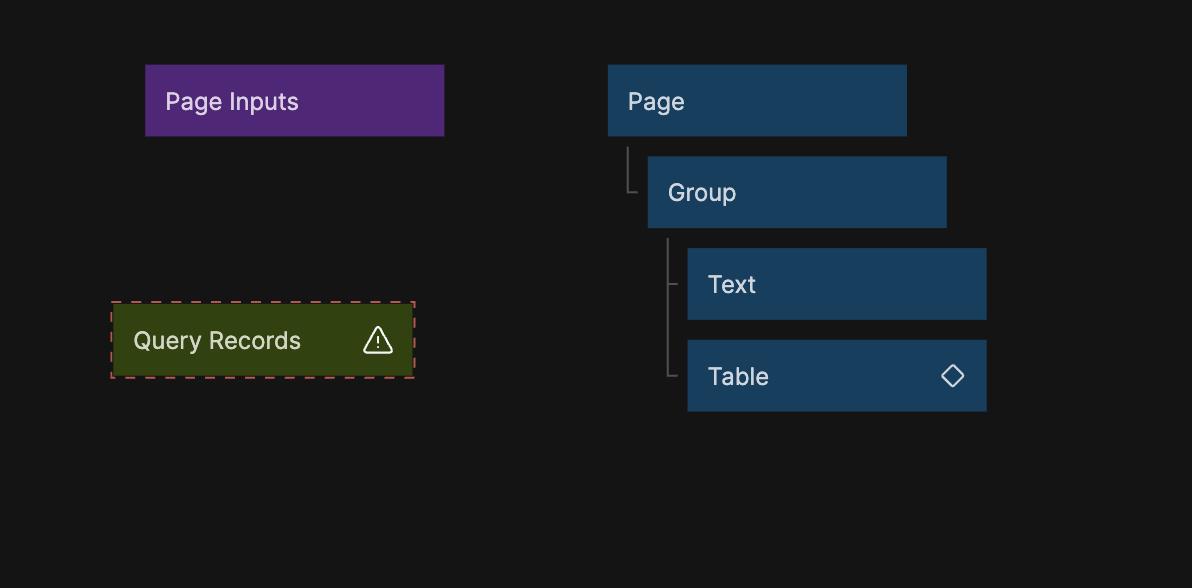
Add a Table node to the node tree, by either dragging it in from the components view or by using the Node Picker. Put the Table under the Text node. Your node graph should look like this:
Adding data to the Table
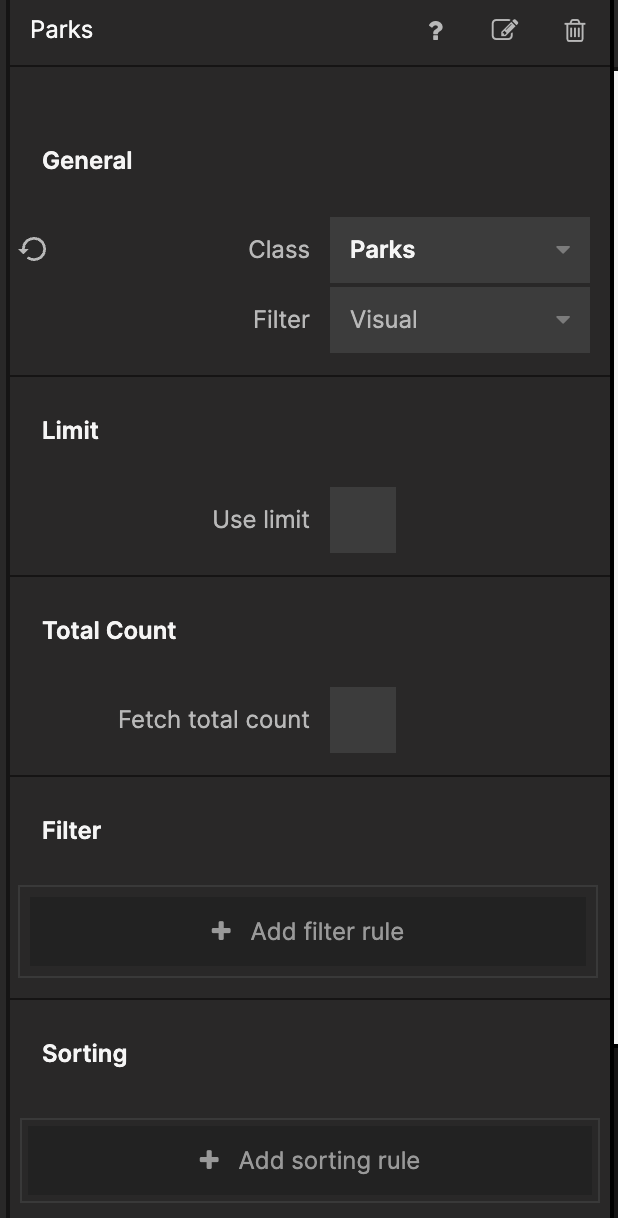
Now that we have a Table let's feed it with data from Parks class. Add a Query Records node to your node graph and tell it to look at the Parks class.
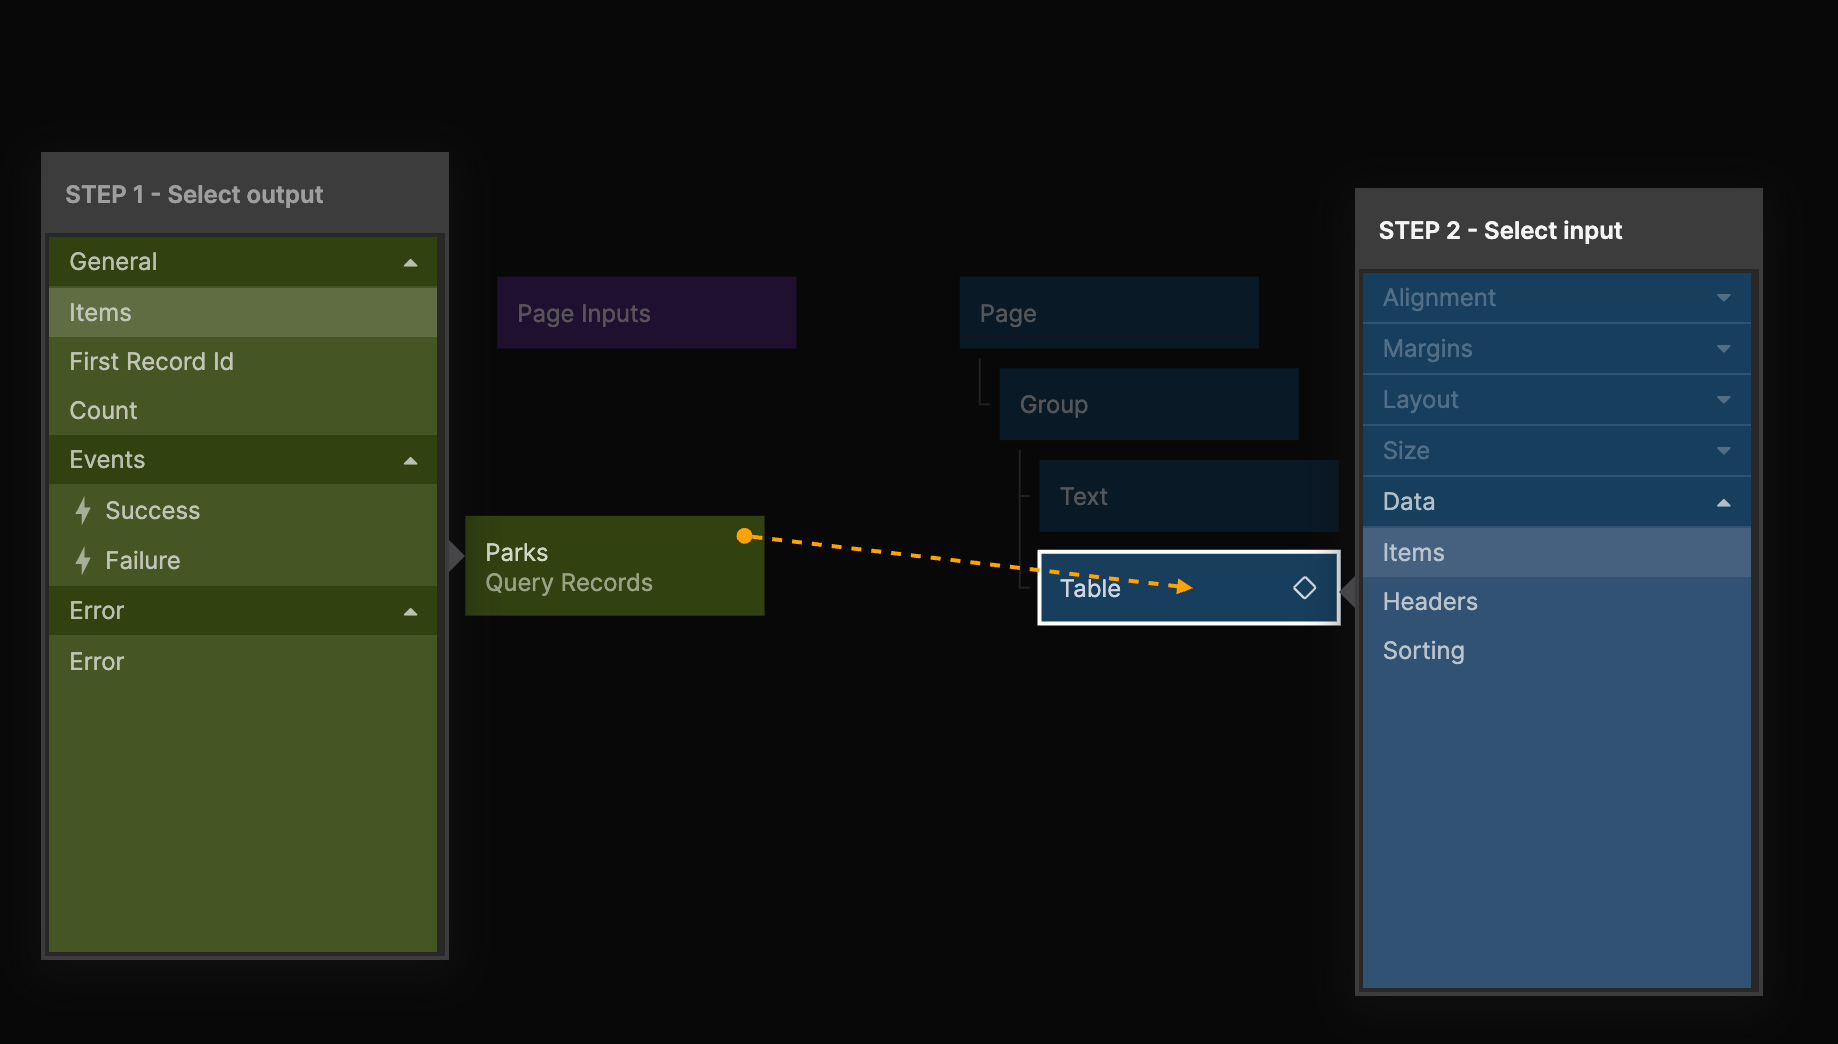
Next connect the Items output from the Query Records node to the Items input of the Table.
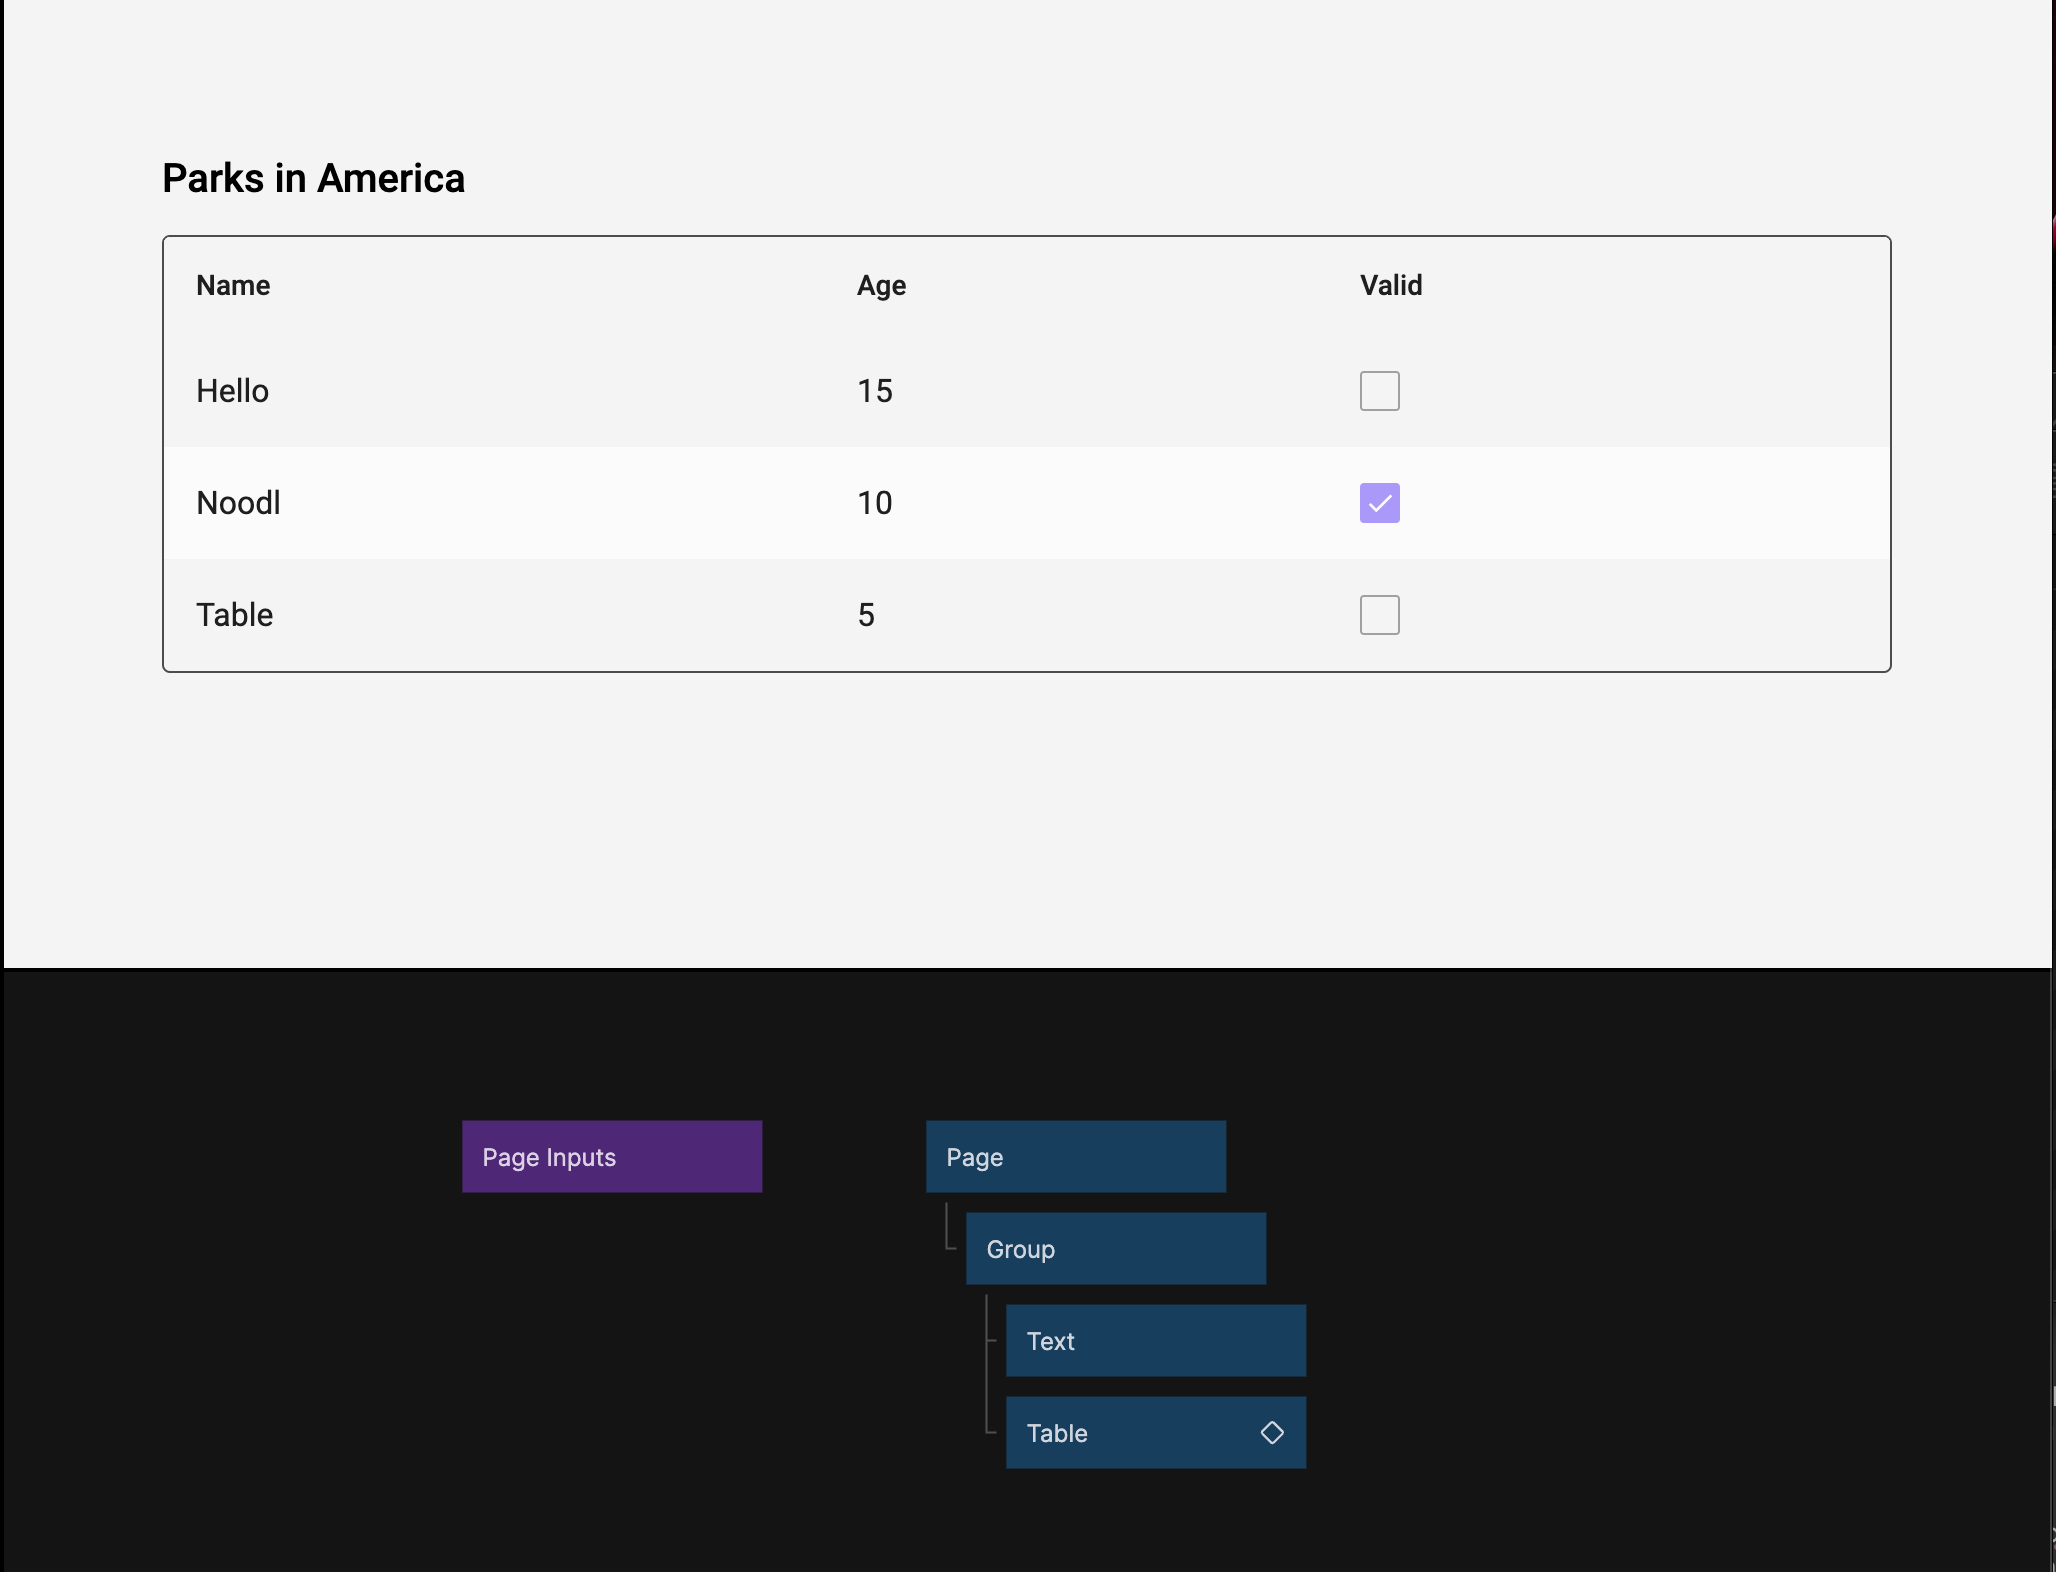
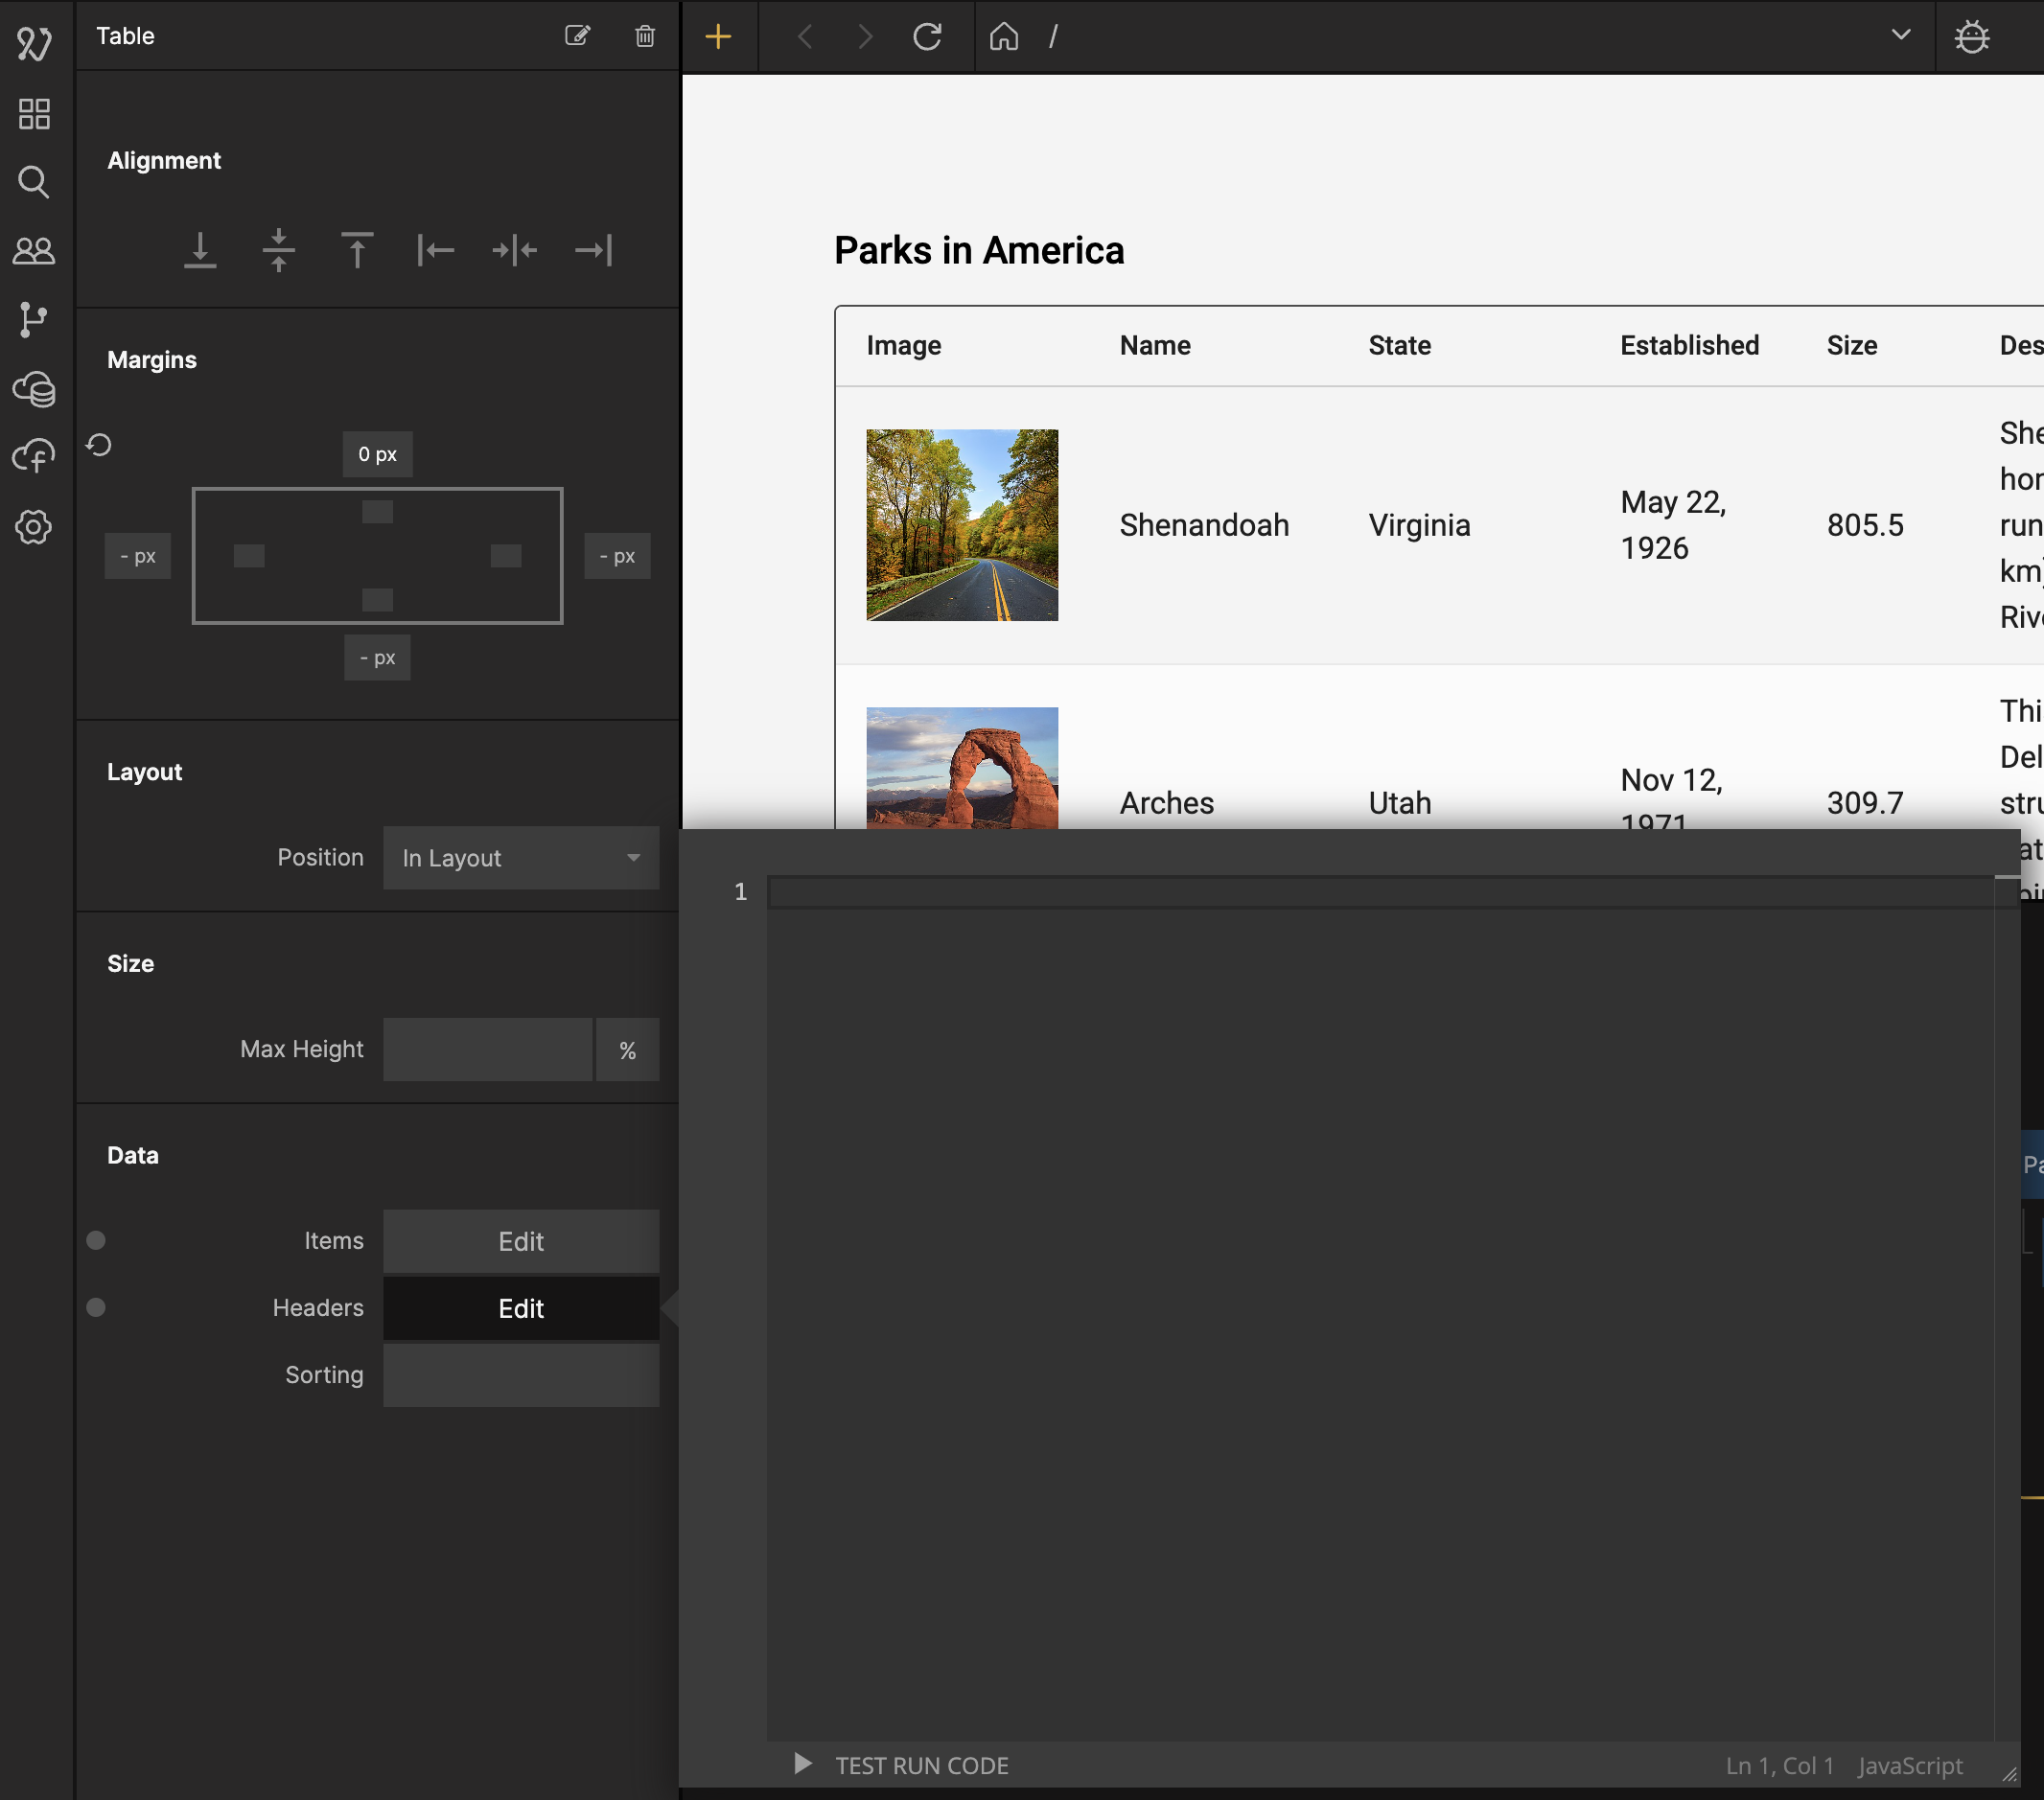
Reload the project. Your table should now look like the image below:
You might have noticed that when you reload the project, the Table shows some default data before the Query Records node has retrieved our parks data. To remove that default data, select the Table and click the Edit button for the Items and remove the objects in the array, so that you are left with an empty array like this:
![]()
Now if you reload your project the Table will be empty until it gets data from the Query Records node.
Customizing the Header titles and what data to show
By default the Table node will display all the data fields it gets from the Query Records, and will use the same title for the header as the column name in the class.
By editing the Headers property we can control which fileds that are shown, what order the fields are shown, and we can change the titles to something more friendly than the default column names.
Click the Edit button next to the Headers property and fill in the following. You can refer to the Table documentation for a deeper explanation of how the Headers work.
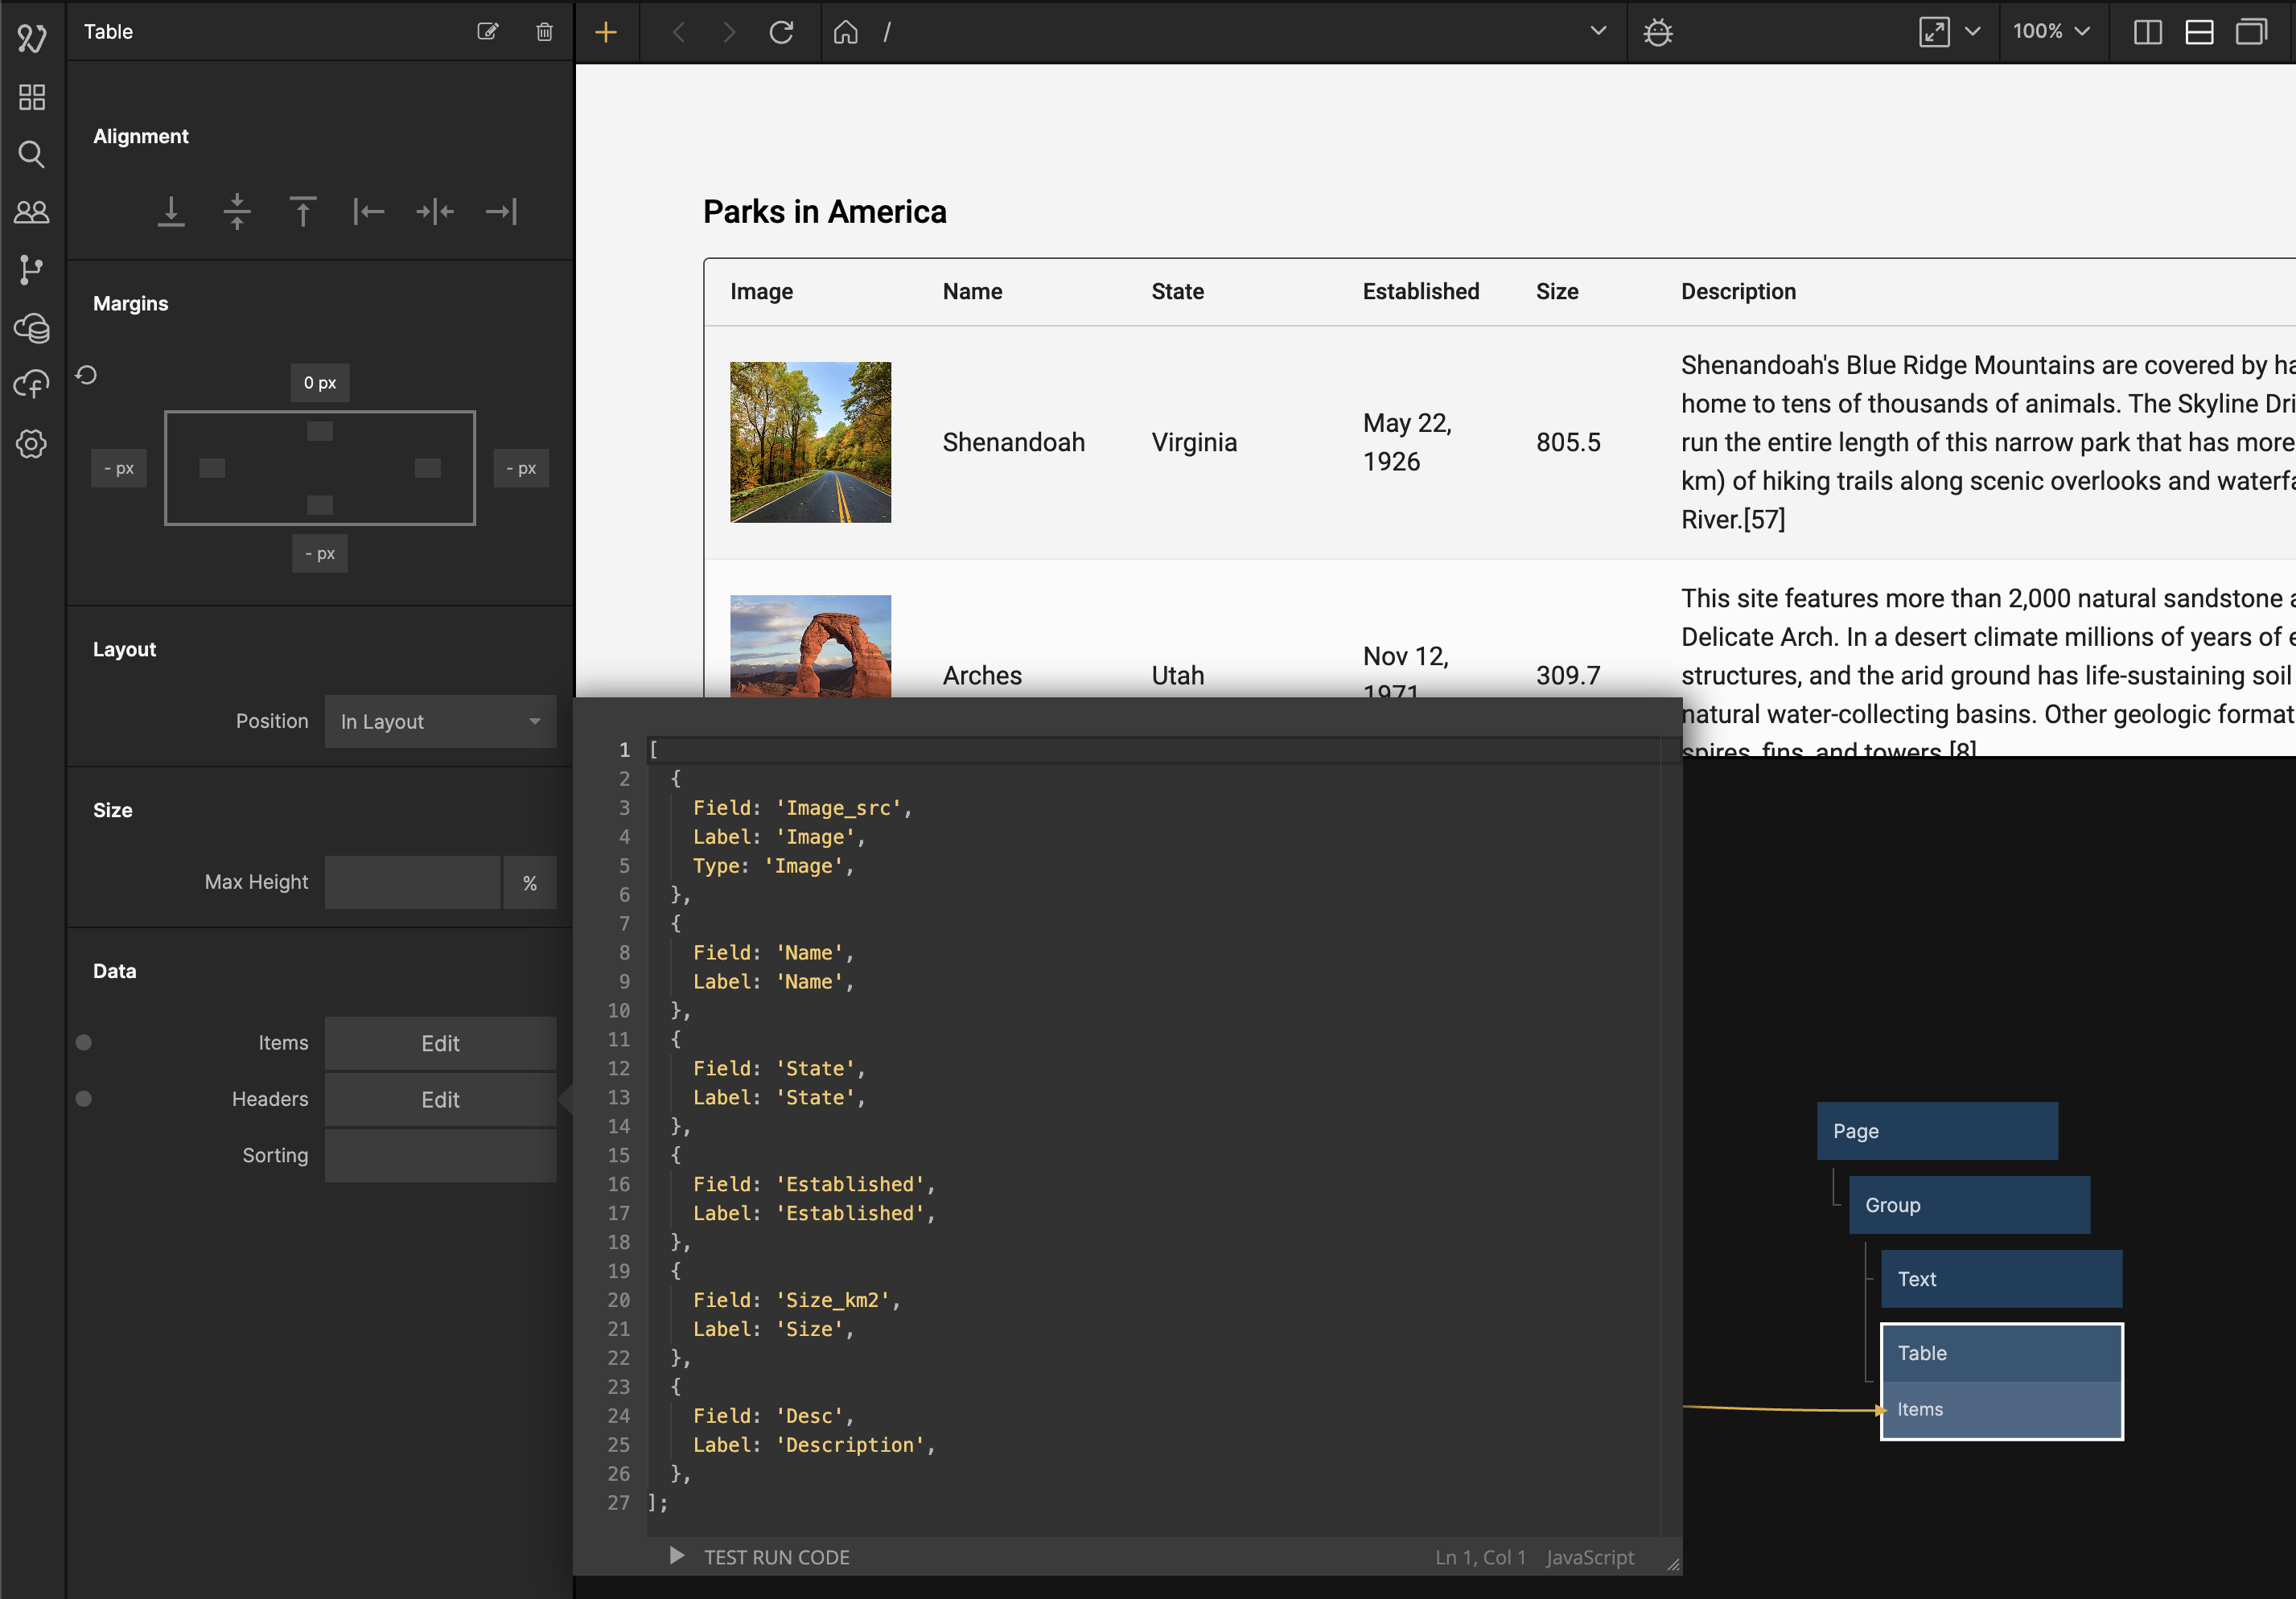
Then add the following code to the Headers section:
[
  {
    Field: 'Image_src',
    Label: 'Image',
    Type: 'Image',
  },
  {
    Field: 'Name',
    Label: 'Name',
  },
  {
    Field: 'State',
    Label: 'State',
  },
  {
    Field: 'Established',
    Label: 'Established',
  },
  {
    Field: 'Size_km2',
    Label: 'Size',
  },
  {
    Field: 'Desc',
    Label: 'Description',
  },
];
Here is a screenshot of the final result:
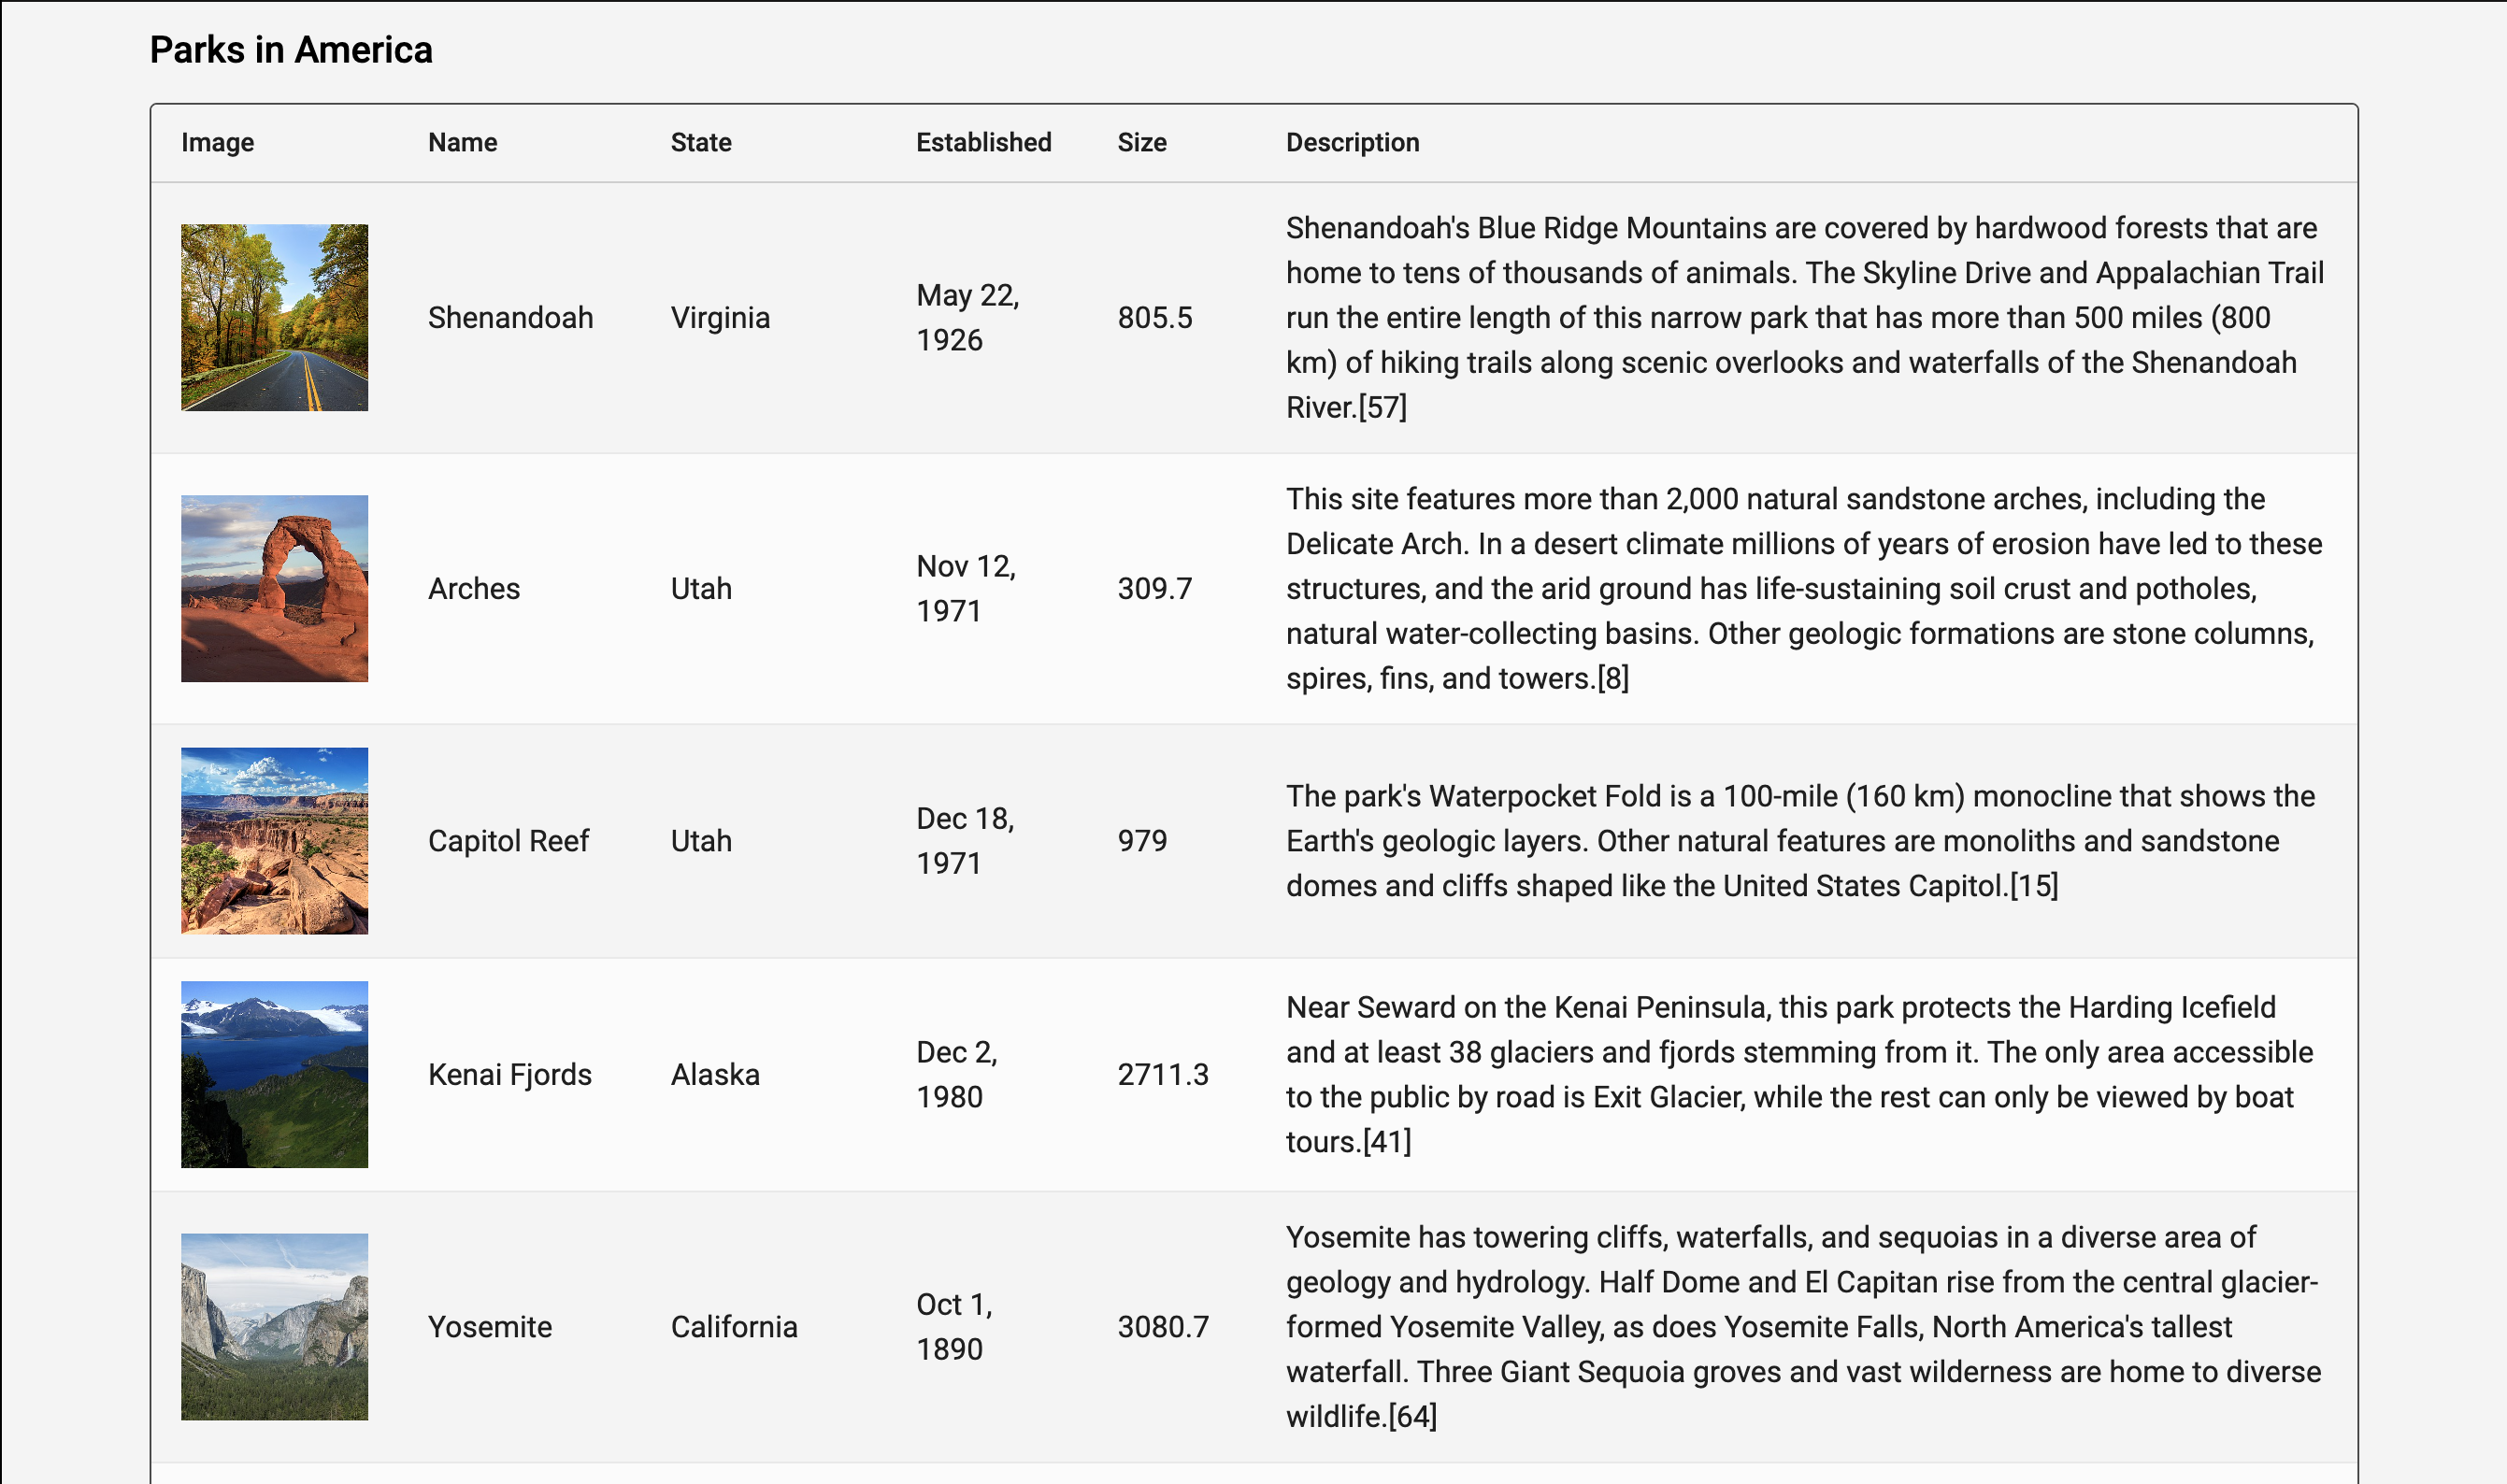
Summary
In this guide we used a Table node to display data from a Query Records node and we used the Headers property on the Table node to control what data to show and in what order.