Line Chart
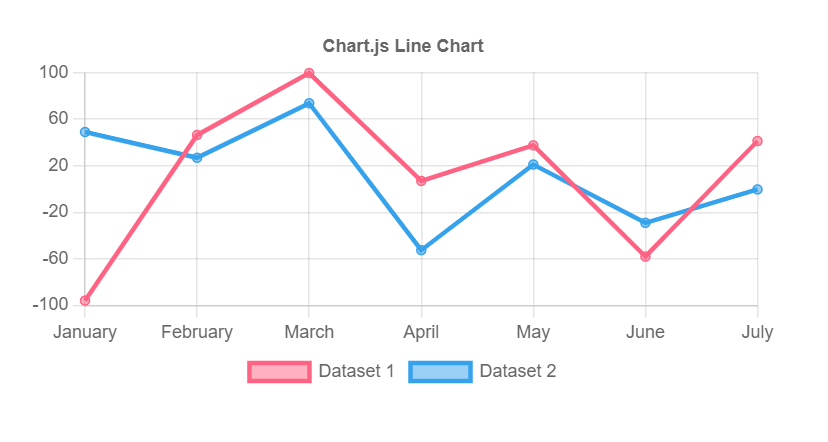
This visual node adds a line chart to the visual tree.
Here is an example how to use used the node.
General Options
| Data | Description |
|---|
| Index Axis | |
| Responsive | Resizes the chart canvas when its parent node changes size. |
| Maintain Aspect Ratio | Maintain the original canvas aspect ratio (width / height) when resizing. |
| Aspect Ratio | Canvas aspect ratio (i.e. width / height, a value of 1 representing a square canvas). Default: 1 |
Animation
| Data | Description |
|---|
| On Data Update | When false, it wont animate when you update the data object. (Preventing Animations) |
Title
| Data | Description |
|---|
| Show Title | Is the title shown? |
| Text | Title text to display. |
| Align | Alignment of the title. |
| Position | Position of title. |
| Color | Color of text. |
Title Font
| Data | Description |
|---|
| Font Family | The font family. |
| Font Size | The font size. |
| Font Style | The font style. |
| Weight | The font weight (boldness). |
| Line Height | The height of an individual line of text. |
Tooltips
| Data | Description |
|---|
| Show Tooltips | Are on-canvas tooltips enabled? |
| Mode | Sets which elements appear in the tooltip. |
| Position | The mode for positioning the tooltip. |
| Background Color | Background color of the tooltip. |
| Body Color | Color of body text. |
| Spacing | Spacing to add to top and bottom of each tooltip item. |
| Corner Radius | Radius of tooltip corner curves. |
| Display Colors | If true, color boxes are shown in the tooltip. |
Tooltips Font
| Data | Description |
|---|
| Font Family | The font family. |
| Font Size | The font size. |
| Font Style | The font style. |
| Weight | The font weight (boldness). |
| Line Height | The height of an individual line of text. |
Legend Labels
| Data | Description |
|---|
| Text Color | |
| Text Align | |
| Use Point Style | |
| Point Style | |
Legend Label Font
| Data | Description |
|---|
| Font Family | The font family. |
| Font Size | The font size. |
| Font Style | The font style. |
| Weight | The font weight (boldness). |
| Line Height | The height of an individual line of text. |
Data Decimation
| Data | Description |
|---|
| Enabled | Is decimation enabled? |
| Algorithm | Decimation algorithm to use. See the more... |
| Samples | If the lttb algorithm is used, this is the number of samples in the output dataset. Defaults to the canvas width to pick 1 sample per pixel. |
| Threshold | If the number of samples in the current axis range is above this value, the decimation will be triggered. Defaults to 4 times the canvas width. The number of point after decimation can be higher than the threshold value. |
Interaction
| Data | Description |
|---|
| Intersect | If true, the interaction mode only applies when the mouse position intersects an item on the chart. |
| Mode | Sets which elements appear in the interaction. |
| Axis | |
| Include Invisible | If true, the invisible points that are outside of the chart area will also be included when evaluating interactions. |
Outputs
Click Event
Before Event
Debug
| Data | Description |
|---|
| Chart.js Options | |