Chart.js Module

This module allows you to add charts to your Noodl App, using Chart.js.
Supported chart types:
- Line and Area
- Bar
- Radar
- Doughnut
- Pie
- Polar Area
- Bubble
- Scatter
There are many different kinds inputs to change the style of the chart. Like the title, tooltip and legends.
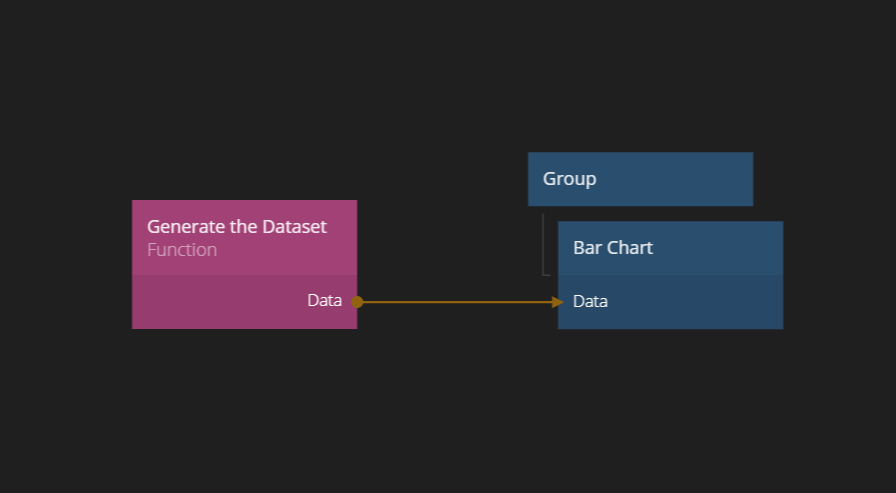
Changing the Data
To style the chart data, it should be added next to the data it want to style. To recreate for example this chart (Bar Chart Border Radius). It should send the style in the datasets to the chart.
Outputs.Data = {
    labels: [
        "January",
        "February",
        "March",
        "April",
        "May",
        "June",
        "July"
    ],
    datasets: [
        {
            label: "Fully Rounded",
            data: [99, 41, 94, 1, 32, -63, 36]
            borderColor: "rgb(255, 99, 132)",
            backgroundColor: "rgba(255, 99, 132, 0.5)",
            borderWidth: 2,
            borderRadius: 1.8,
            borderSkipped: false
        },
        {
            label: "Small Radius",
            data: [-59, -80, -62, -25, -40, 58, 95],
            borderColor: "rgb(54, 162, 235)",
            backgroundColor: "rgba(54, 162, 235, 0.5)",
            borderWidth: 2,
            borderRadius: 5,
            borderSkipped: false
        }
    ]
}
Changing the Scales
Outputs.Scales = {
    x: {
        stacked: true
    },
    y: {
        stacked: true
    }
}