Logging and Debugging
When building cloud functions it's important to know how to spot errors and problems quickly. This is where logging and debugging comes in.
Running locally
When you are running your application in the Noodl editor all cloud functions are run on your local computer. The are accessing the active cloud service of the project, just as they will when deployed. The easiest way to find errors in your cloud functions is to inspect data and signal connections in your node graph as your functions are running locally.
Simply bring up the cloud functions tab, choose the function you want to inspect and then trigger it from the app preview. You will see the data and signals flowing through your graph and you can inspect the values afterwards just like in your frontend components.
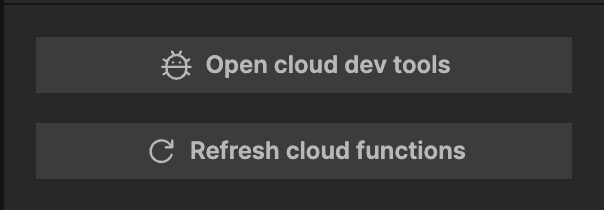
Sometimes this is not enough and we need to open the Cloud Runtime Debugger, you can launch it from the top of the sidebar in the cloud functions tab.
This will open a web debugger, just like when debugging your front end. When your cloud functions run locally they run in a web runtime which means that you have access to all the same debug tools. Most notably you can debug network calls from your function, as well as the logging to the console, more on that in a bit.
The Refresh cloud functions button above is also very useful if you want to clear error messages and inspect data and run your function clean.
If you want to call your cloud functions from external tools while running locally you can do this by accessing the local Noodl clound functions server directly.
curl -X POST http://localhost:8577/functions/my-func -H 'Content-Type: application/json' -d '{"someParameter":"value"}'
This can be very useful when working with e.g. webhooks as they can be tested locally without having to deploy.
Logging
Another important tool to make sure your functions are running as expected is logging, especially when finding problems in deployed applications. When you are running locally you will find the logs in the Cloud Runtime Debugger under the Console tab.
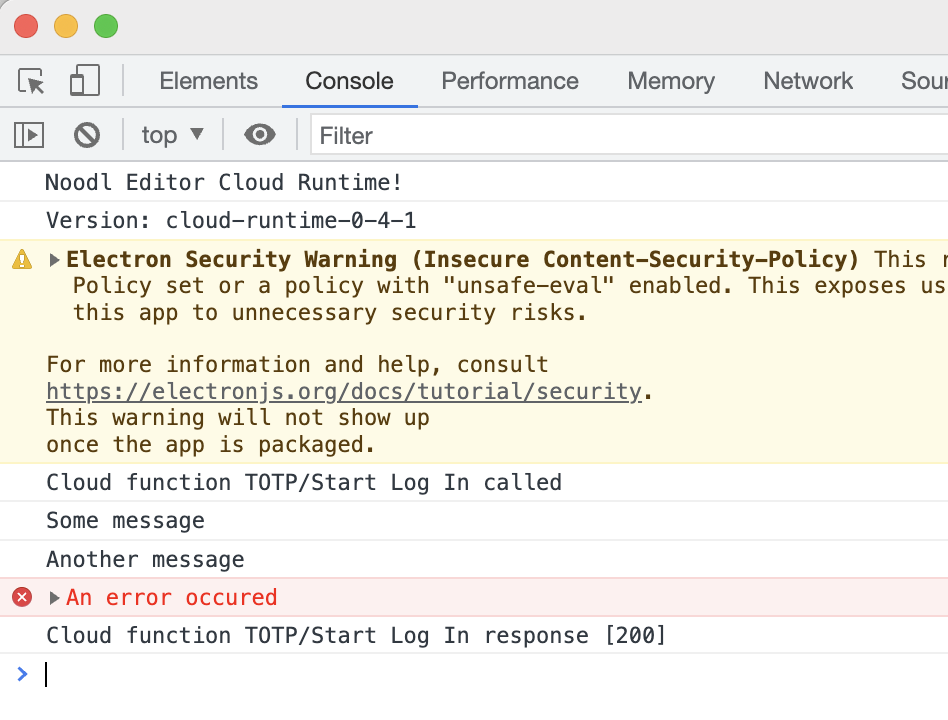
There are three functions you can use to log from your cloud functions:
// These two both log messages as "info" severity
console.log('Some message')
console.info('Another message')

// This is logged with "error" severity and should be reserved for
// critical issues. So they will be easier to find.
console.error("An error occured")
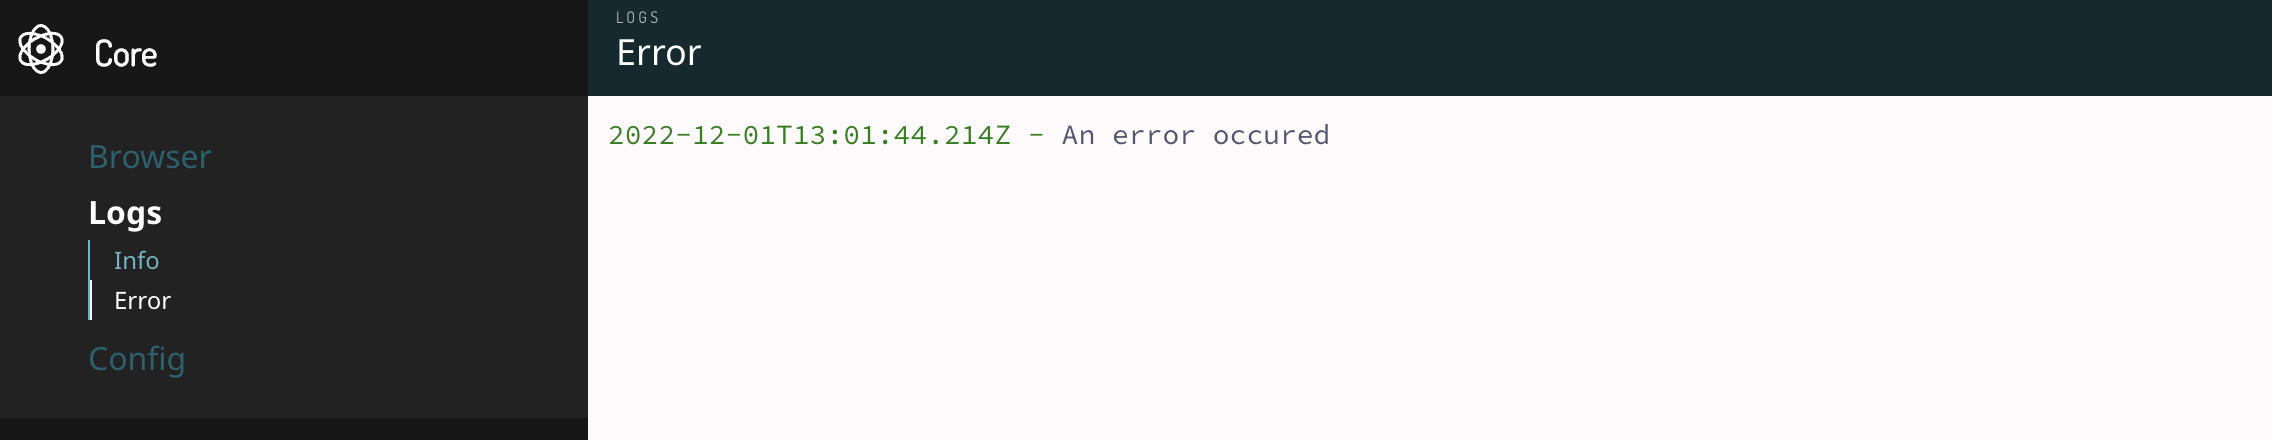
When you have deployed your application you can find the logs in the dashboard for the cloud service that you have deployed to.
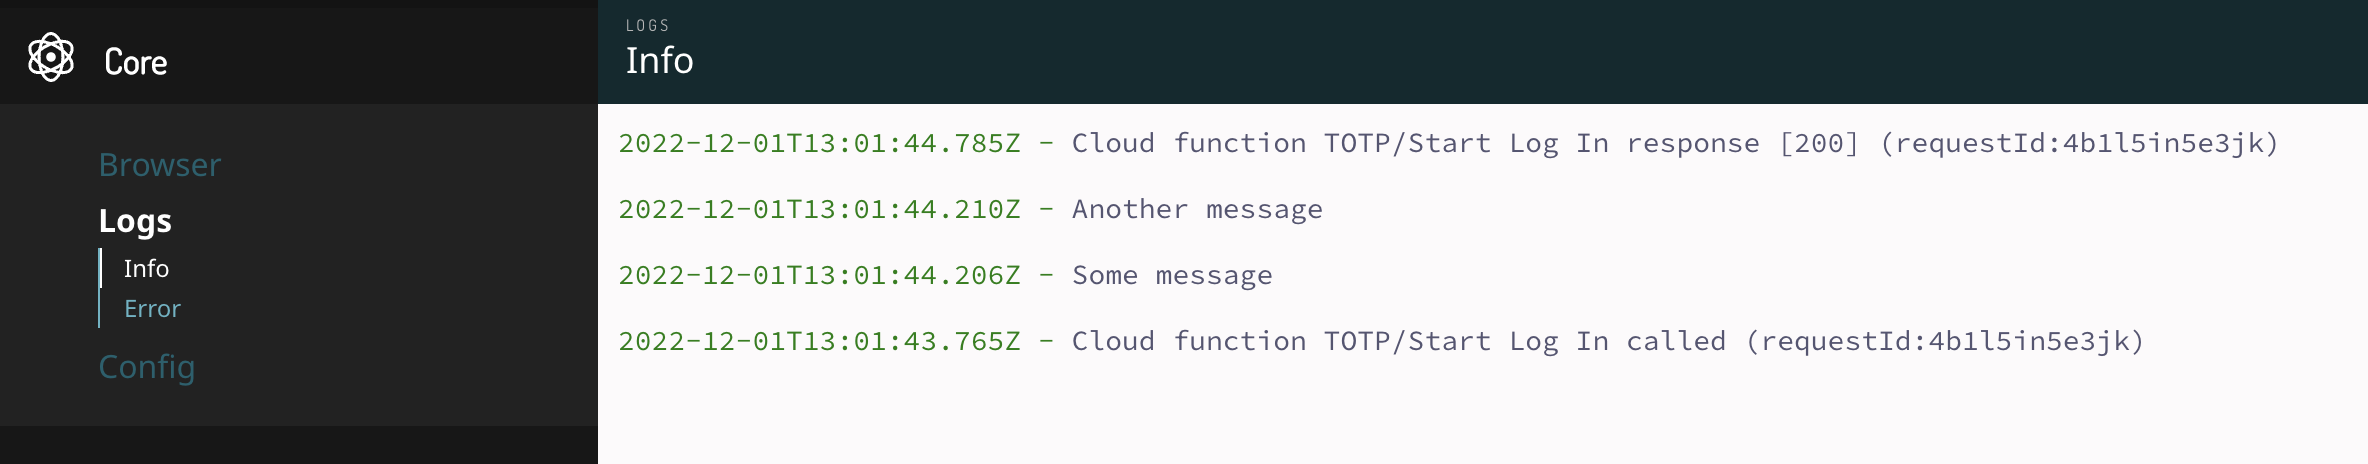
The logs are divided into info and error depending on which log function you used above. If you make sure to reserv error for more critical issues they will be easier to find.