Bar Chart Example
Basic
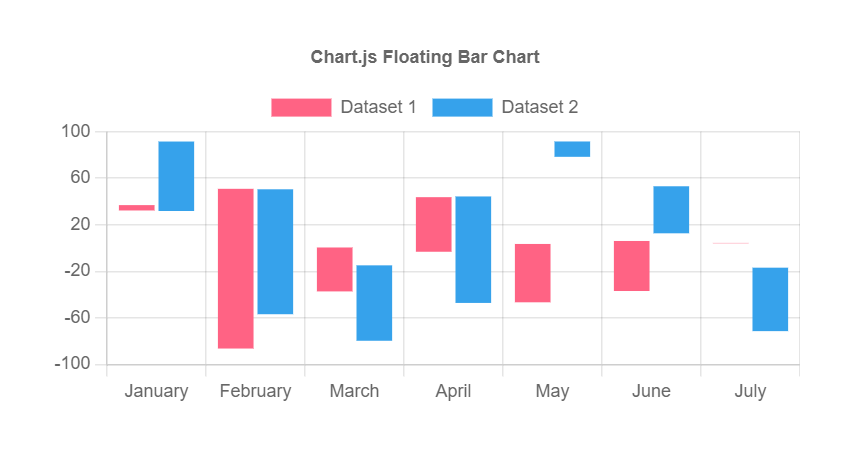
Outputs.Data = {
    labels: ["January", "February", "March", "April", "May", "June", "July"],
    datasets: [
        {
            label: "Dataset 1",
            data: [
                [32, 36],
                [-86, 50],
                [-37, 0],
                [-3, 43],
                [3, -46],
                [-36, 6],
                [3, 4]
            ],
            backgroundColor: "rgb(255, 99, 132)"
        },
        {
            label: "Dataset 2",
            data: [
                [91, 31],
                [50, -56],
                [-79, -14],
                [44, -47],
                [91, 78],
                [12, 53],
                [-71, -16]
            ],
            backgroundColor: "rgb(54, 162, 235)"
        }
    ]
}
Horizontal
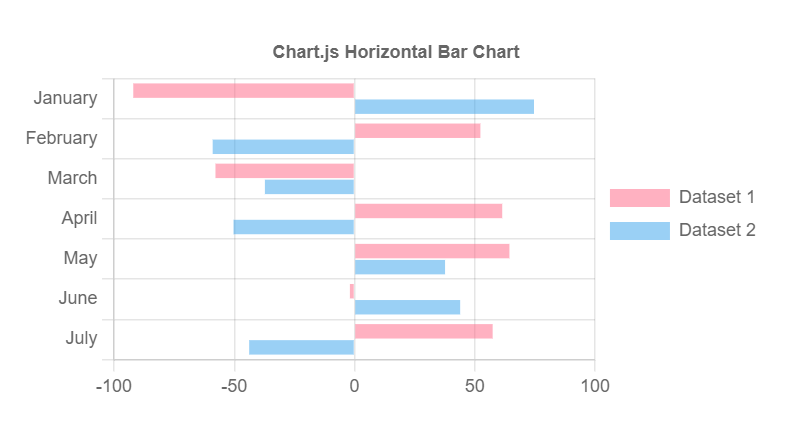
Change the "Index Axis" to "Y" in the property panel.
Outputs.Data = {
    labels: ["January", "February", "March", "April", "May", "June", "July"],
    datasets: [
        {
            label: "Dataset 1",
            data: [-91.99588477, 52.35768176, -57.81550069, 61.43518519, 64.43072702, -1.91529492, 57.45884774],
            borderColor: "rgb(255, 99, 132)",
            backgroundColor: "rgba(255, 99, 132, 0.5)"
        },
        {
            label: "Dataset 2",
            data: [74.65192044, -58.97805213, -37.25823045, -50.31207133, 37.66289438, 43.95061728, -43.79458162],
            borderColor: "rgb(54, 162, 235)",
            backgroundColor: "rgba(54, 162, 235, 0.5)"
        }
    ]
}