Google Sheets Filtering
What you will learn in this guide
This guide will look at how we can apply filters to our Google Sheets data and use that in our example app.
Overview
If you haven't already followed the previous guides for the Google Sheets Module, it's recommended to do that before starting this guide. You can find them [part 1 here](library/modules/gsheets/guides/setting-up/ and part 2 here.
We will go though the following steps:
- Creating a visual filter component.
- Using the Query Sheet Aggregate node to pull out specific data from different columns in the Google Sheet and then ause that data to populate a Dropdown node and Slider that will be used for filtering.
- Creating filters on the Query Sheet node.
Creating the visual Filters component and adding it to the App component
Let's first create a new visual component that we will call Filters.
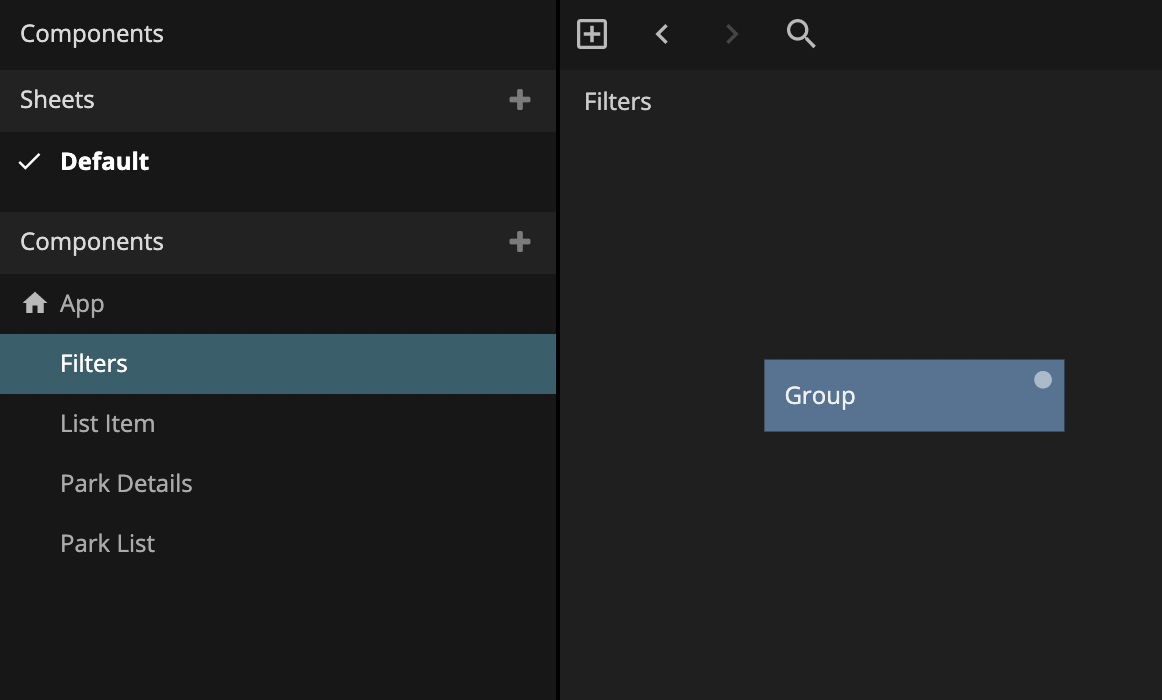
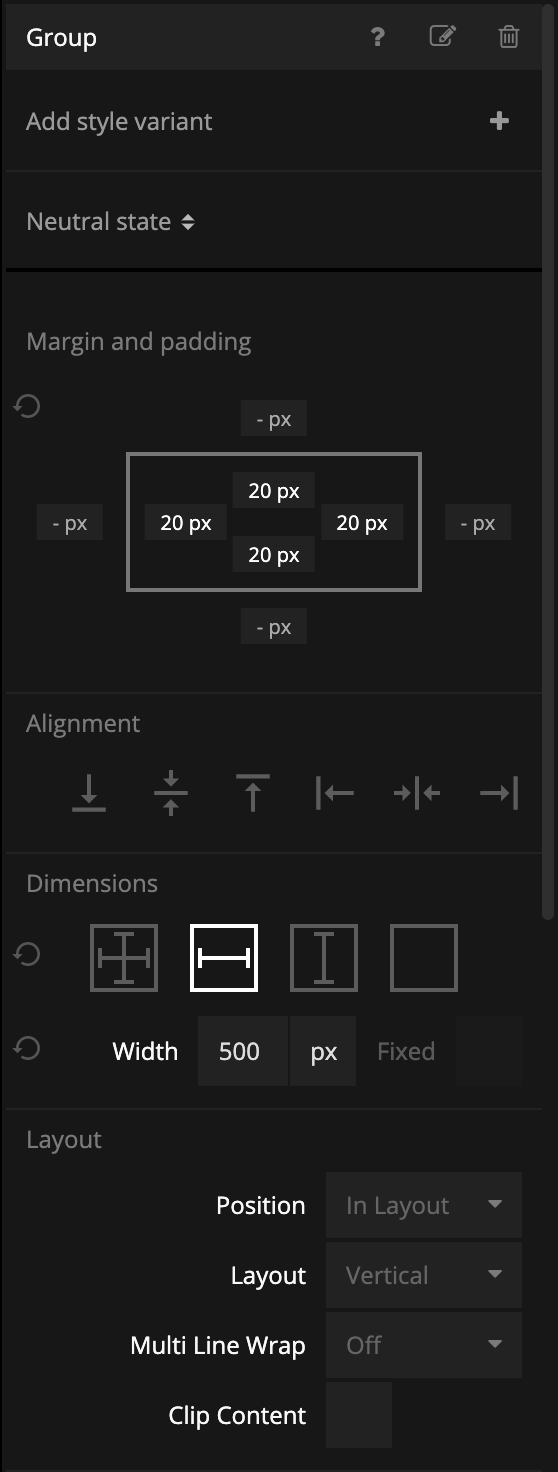
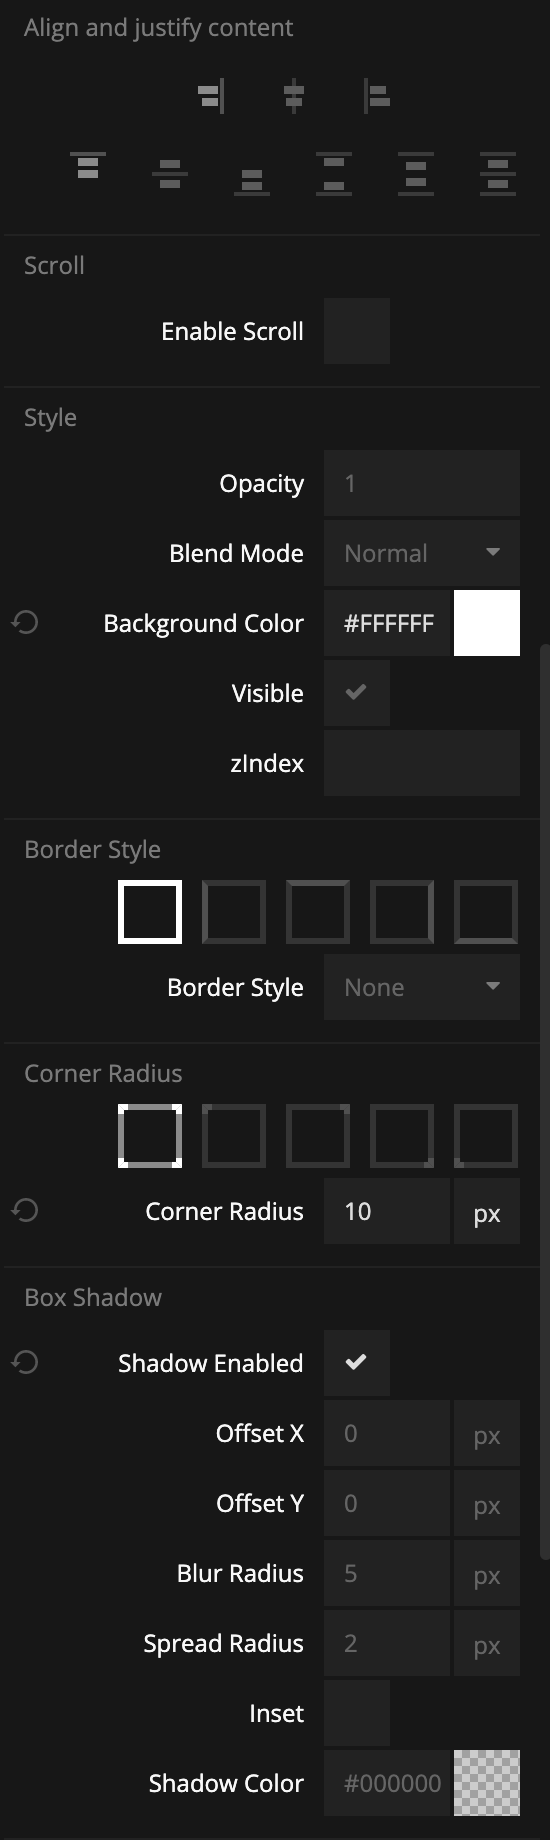
To begin with we will style the Group node in the Filters component like this:
We will soon get back to building out this component, but before we do that, let's add some functionality and visuals in the App component so that we can bring up our Filter component. The first thing we will do is to add a Button. Let's call it Filter Button.
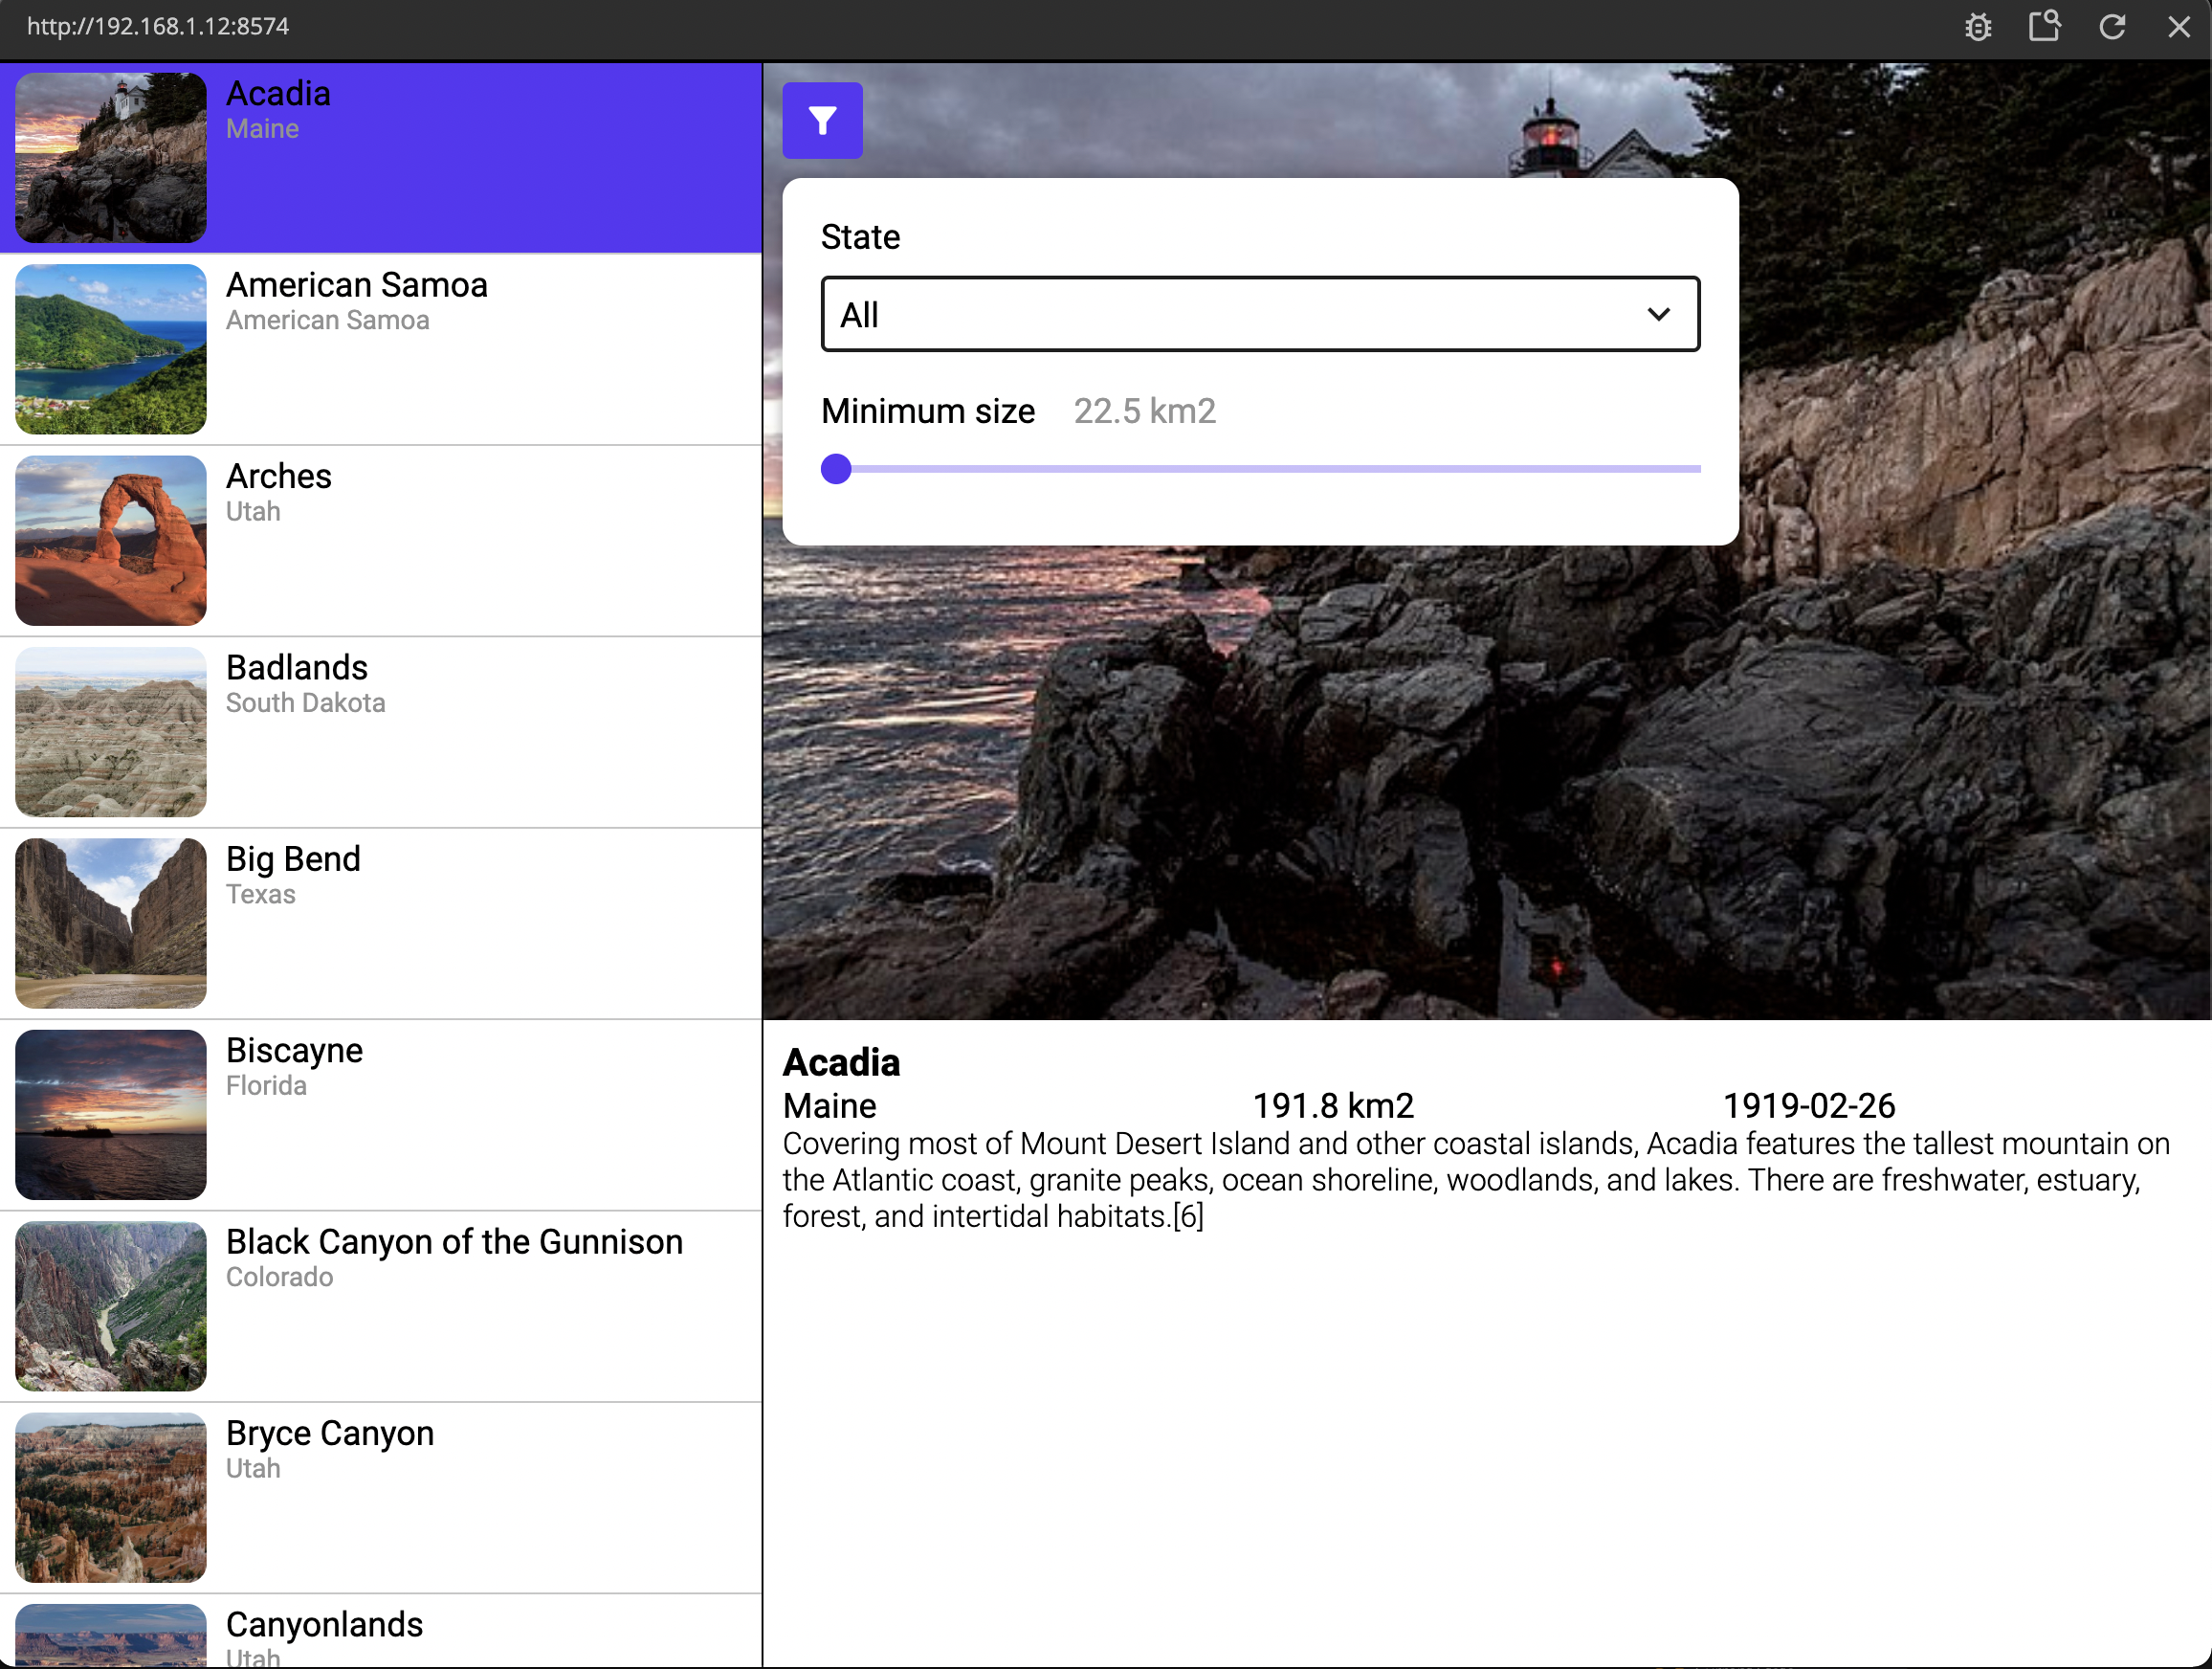
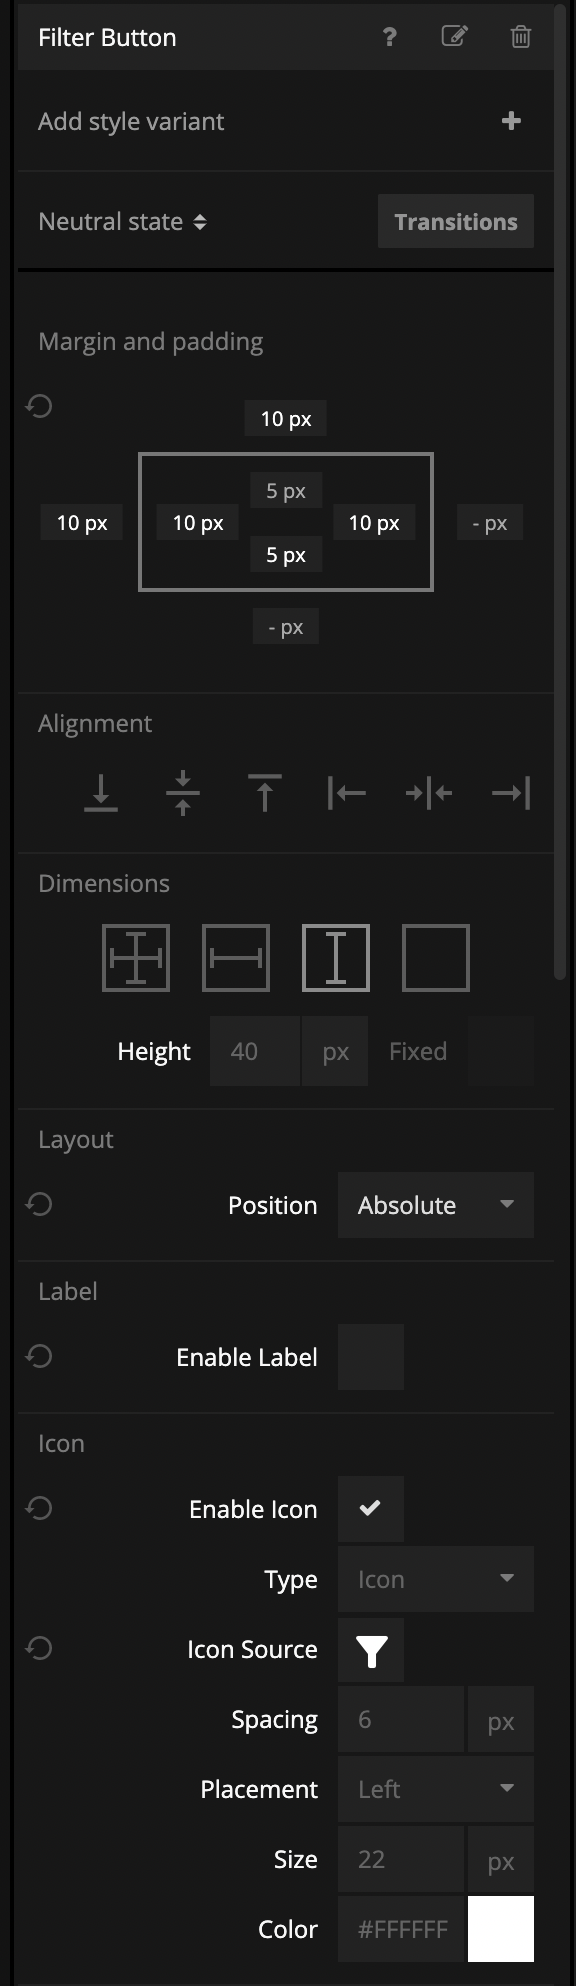
Then let's style the button. We will remove the label and use an icon for the button just like in the images below. It's important that the Button's Position property is set to Absolute. That way we get it to float on top of our Park Details view.
Now that we have a button, let's add an area for our Filters component. Let's add a Group like this:
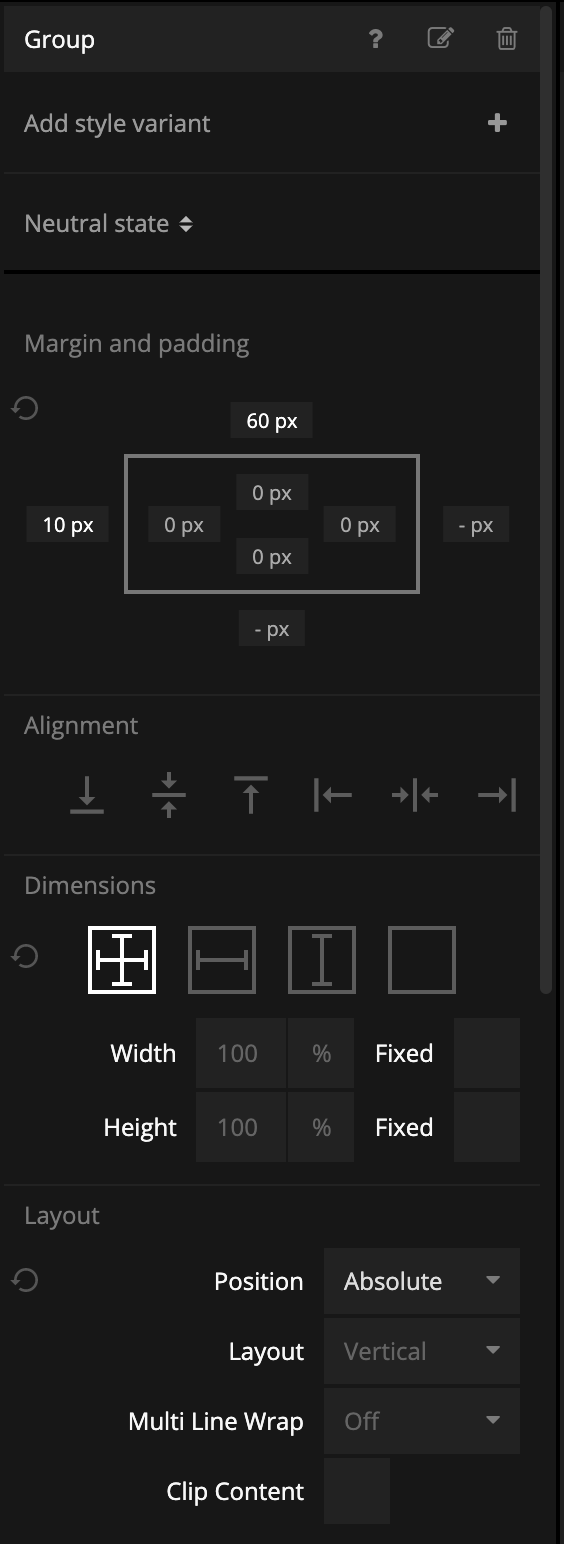
This Group has a bit of styling, and again it's important that the Position is set to Absolute so that it will be on top of our Park Details. Here's the actual styling for the Group.
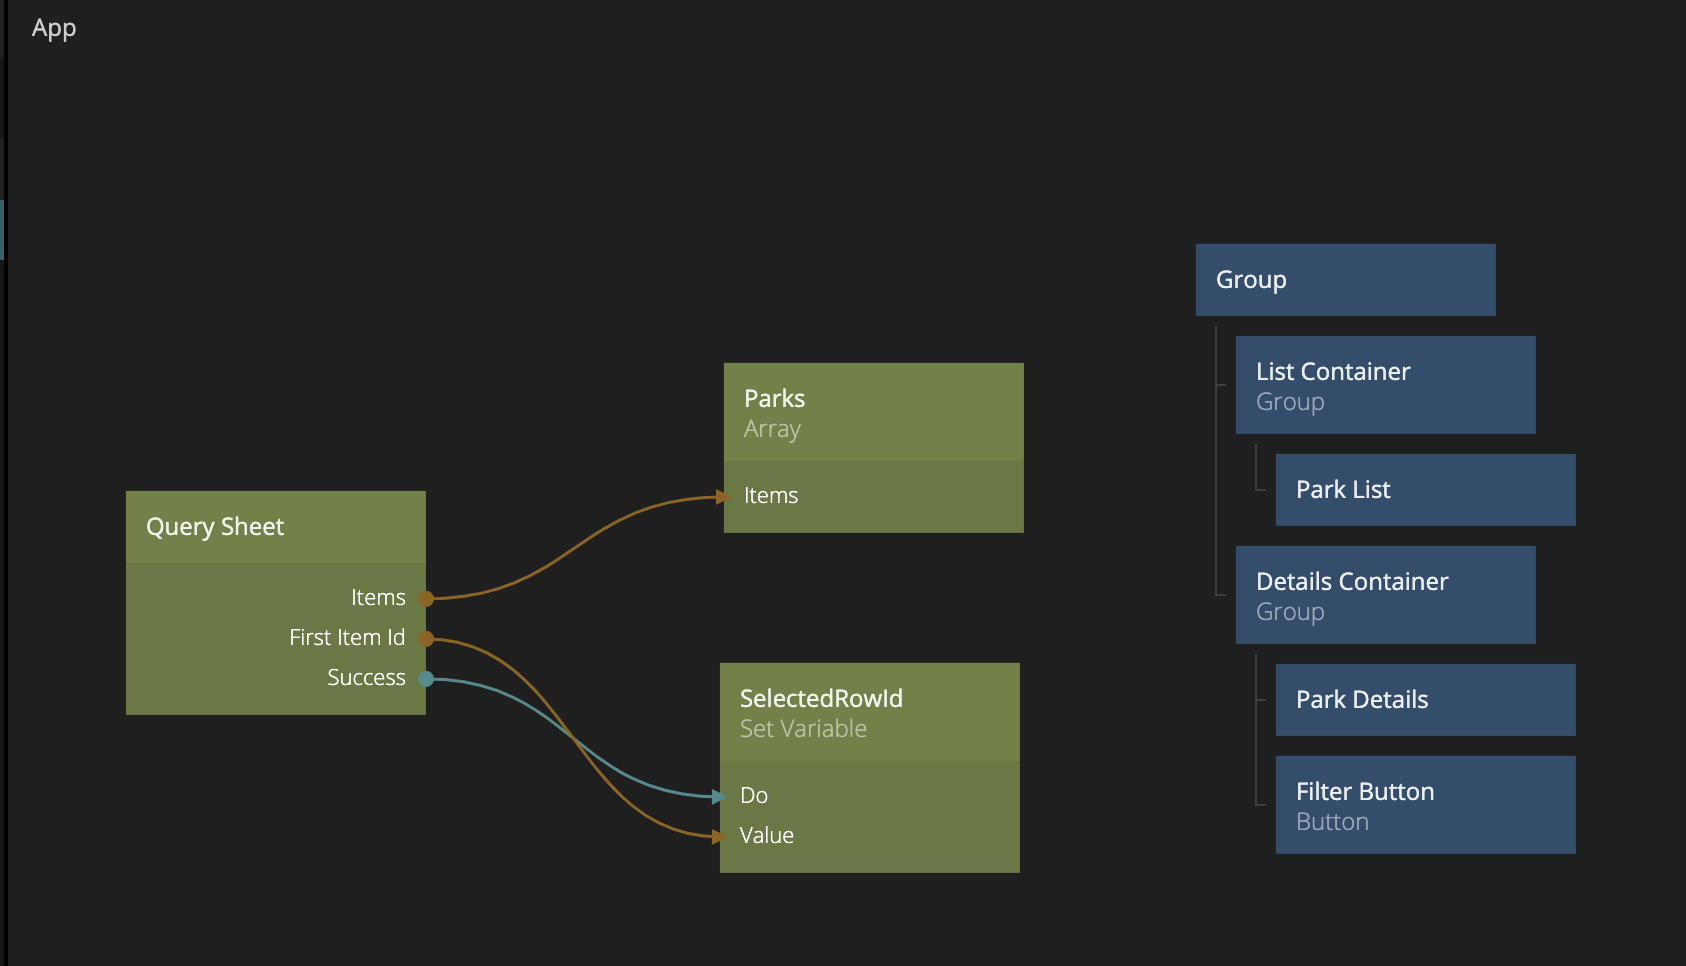
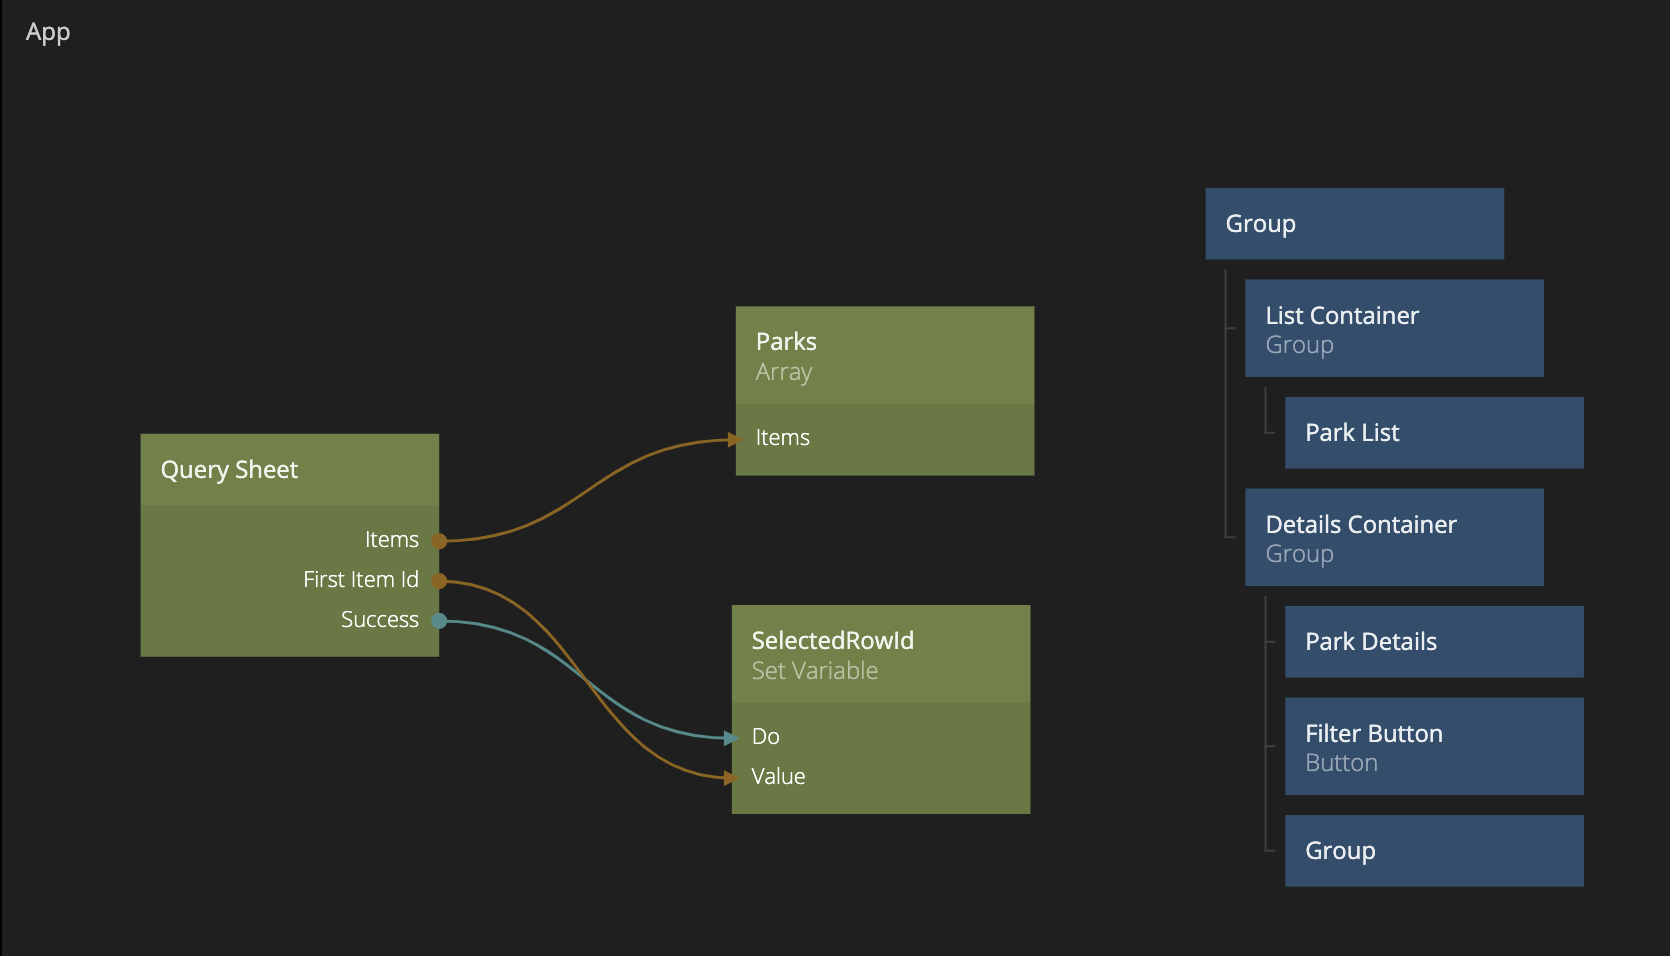
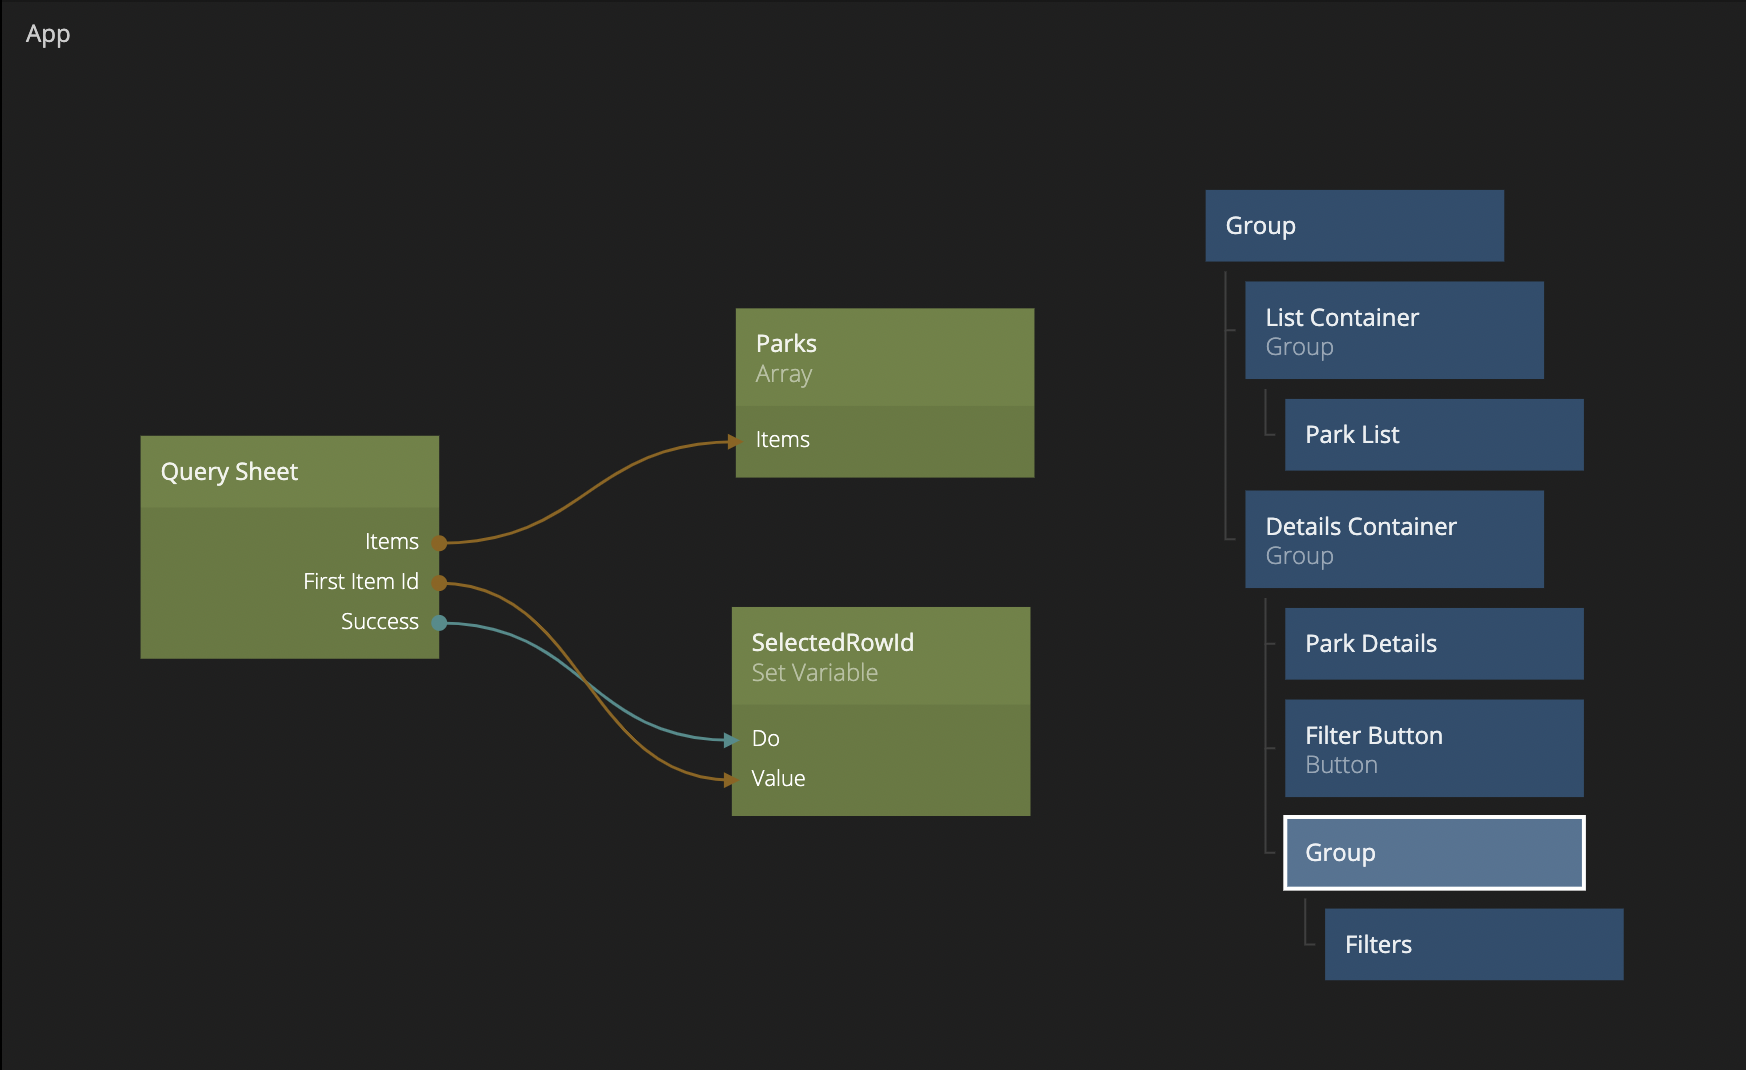
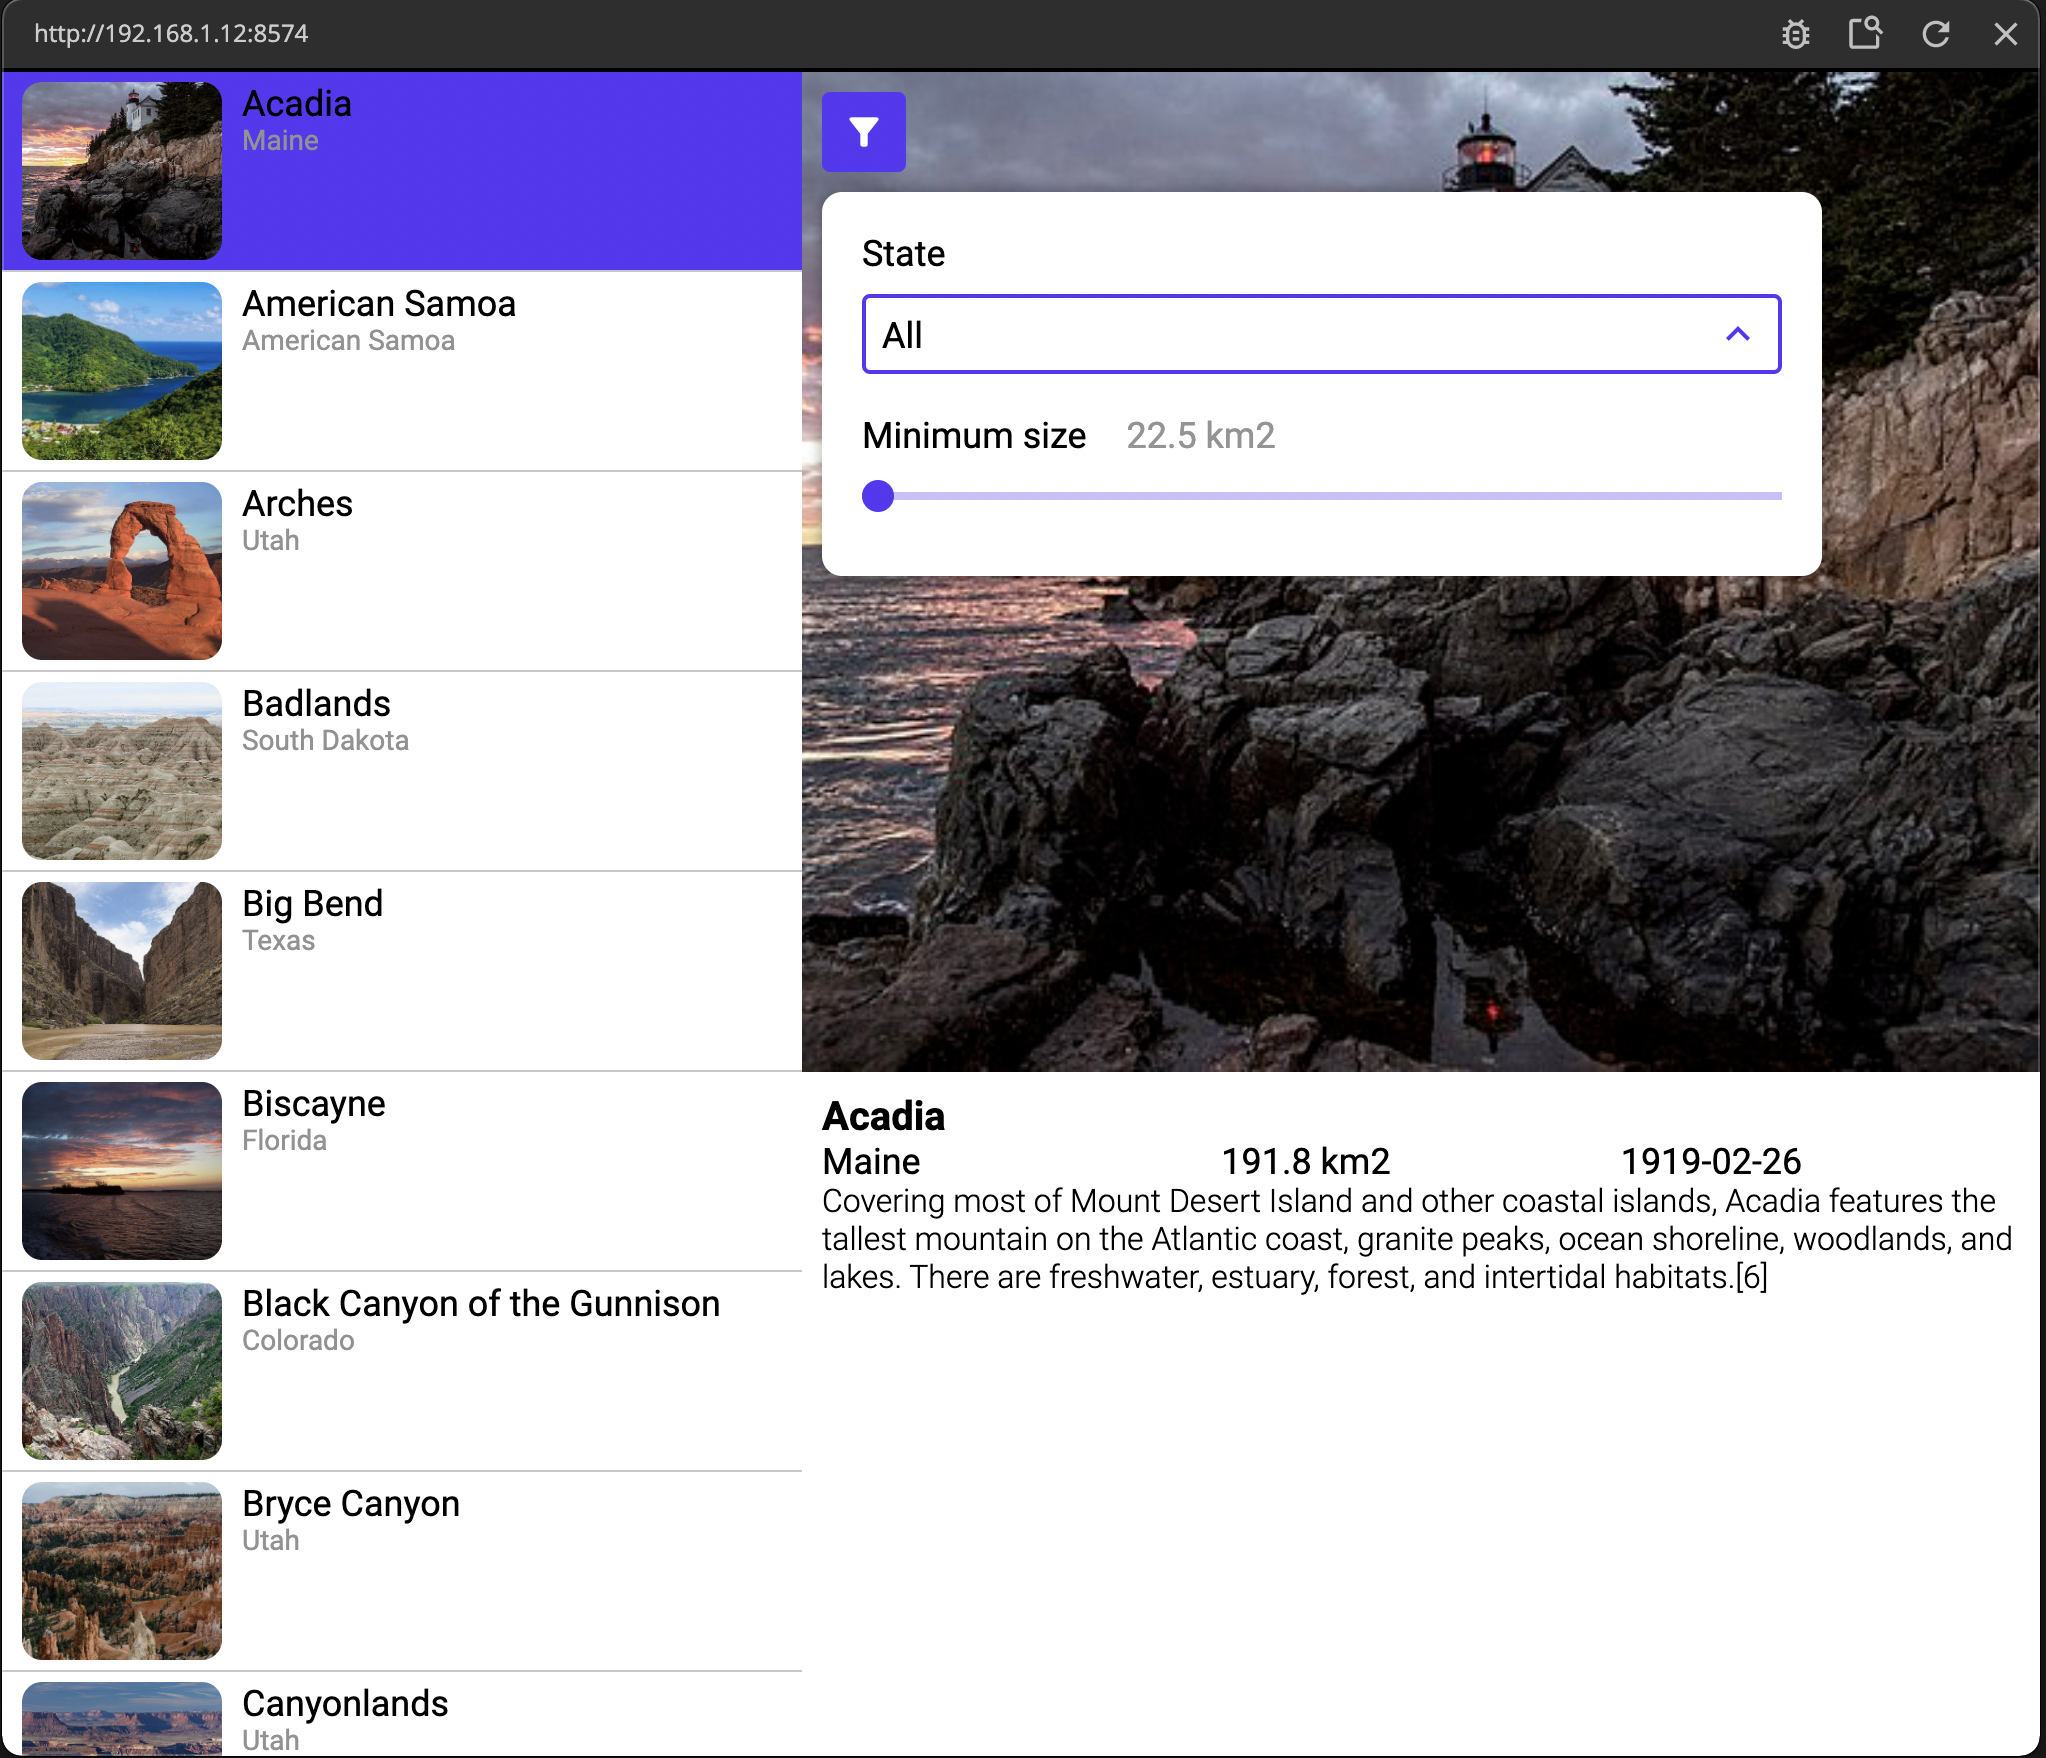
Let's add our Filters component as a child to the Group. The visual node tree in the App component should now look like the first image below, and your preview should look something like the second image.
Hiding and Showing the Filters component
We don't want the Filters component to always be visible, it should only show when you click the Filter Button, and then if you click the Filter Button again, it should hide. We can easily add this functionality by using a Switch node, and hook it up like below:
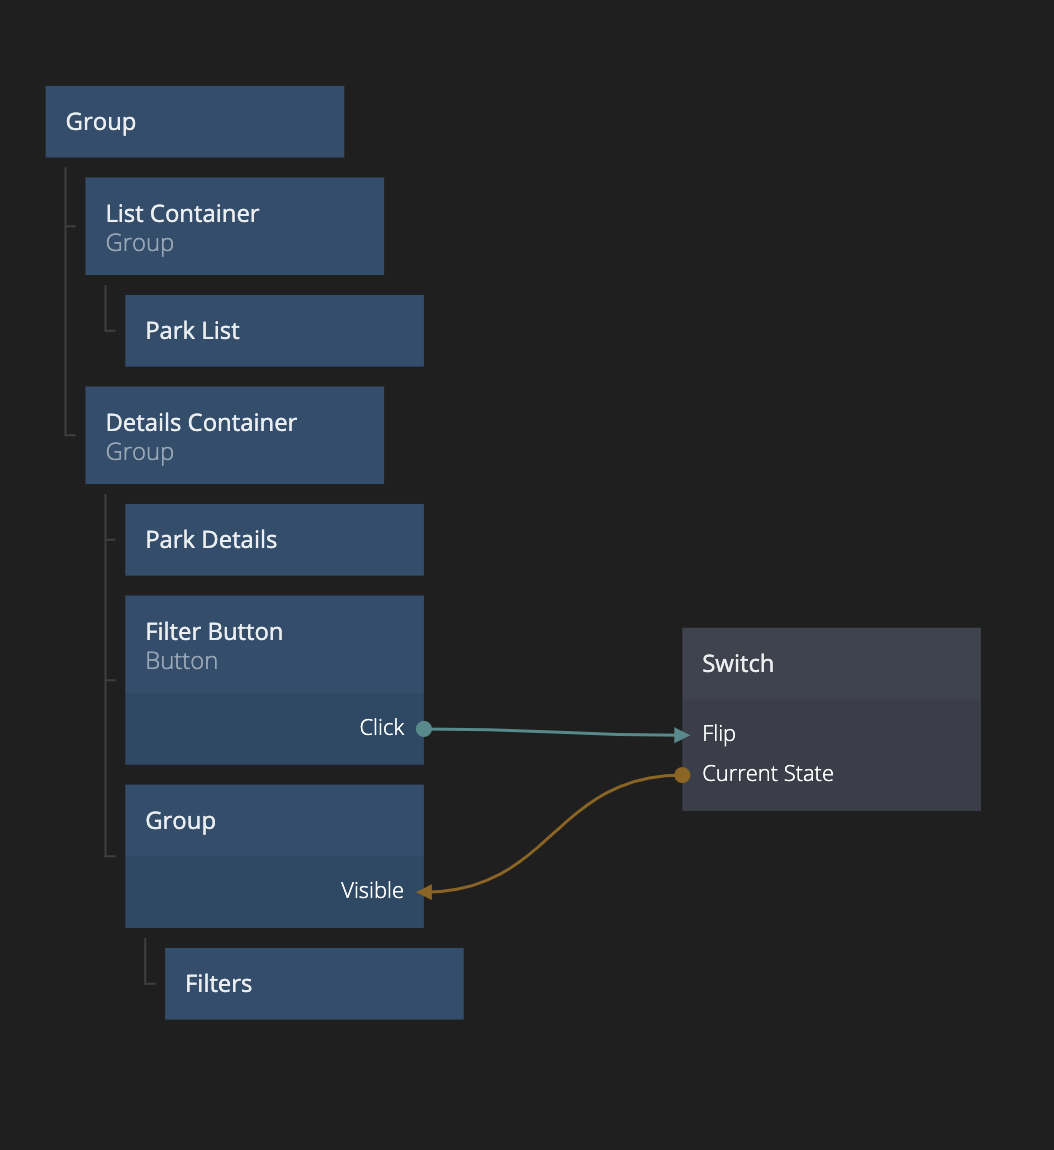
Now, when you click on the Filter Button you should alternately hide and show the Filters component.
Finishing the visuals for the Filters component
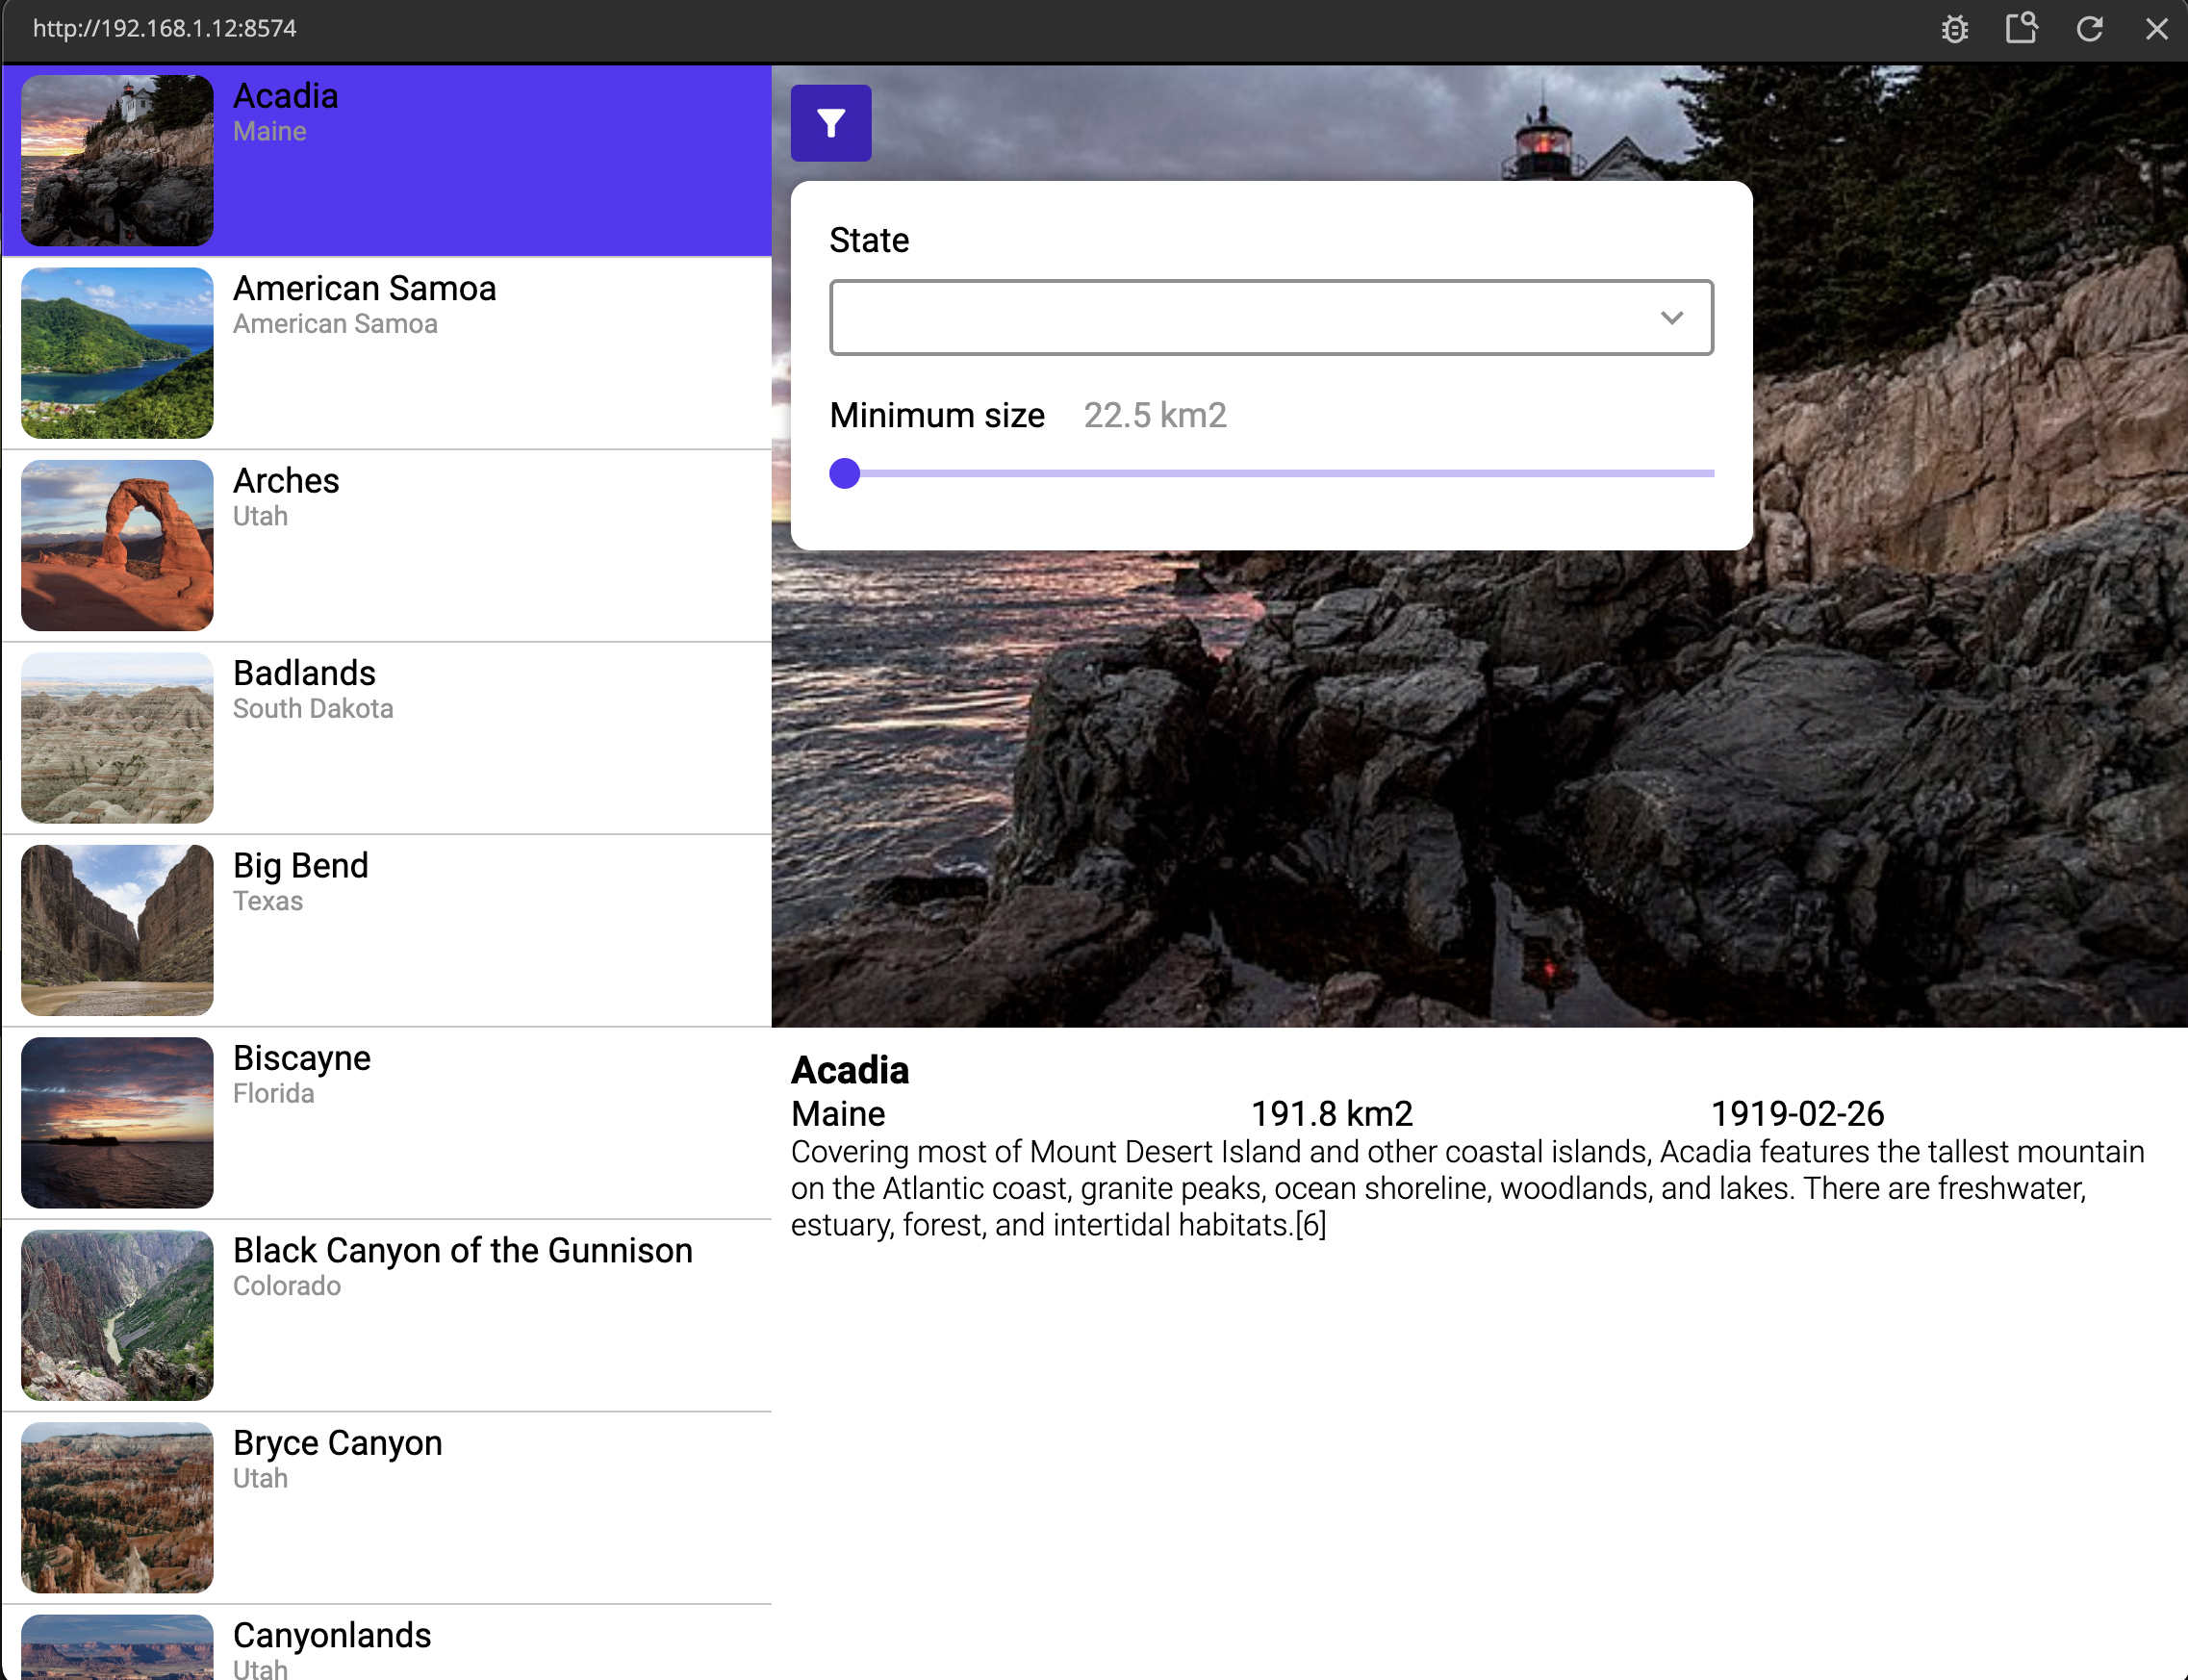
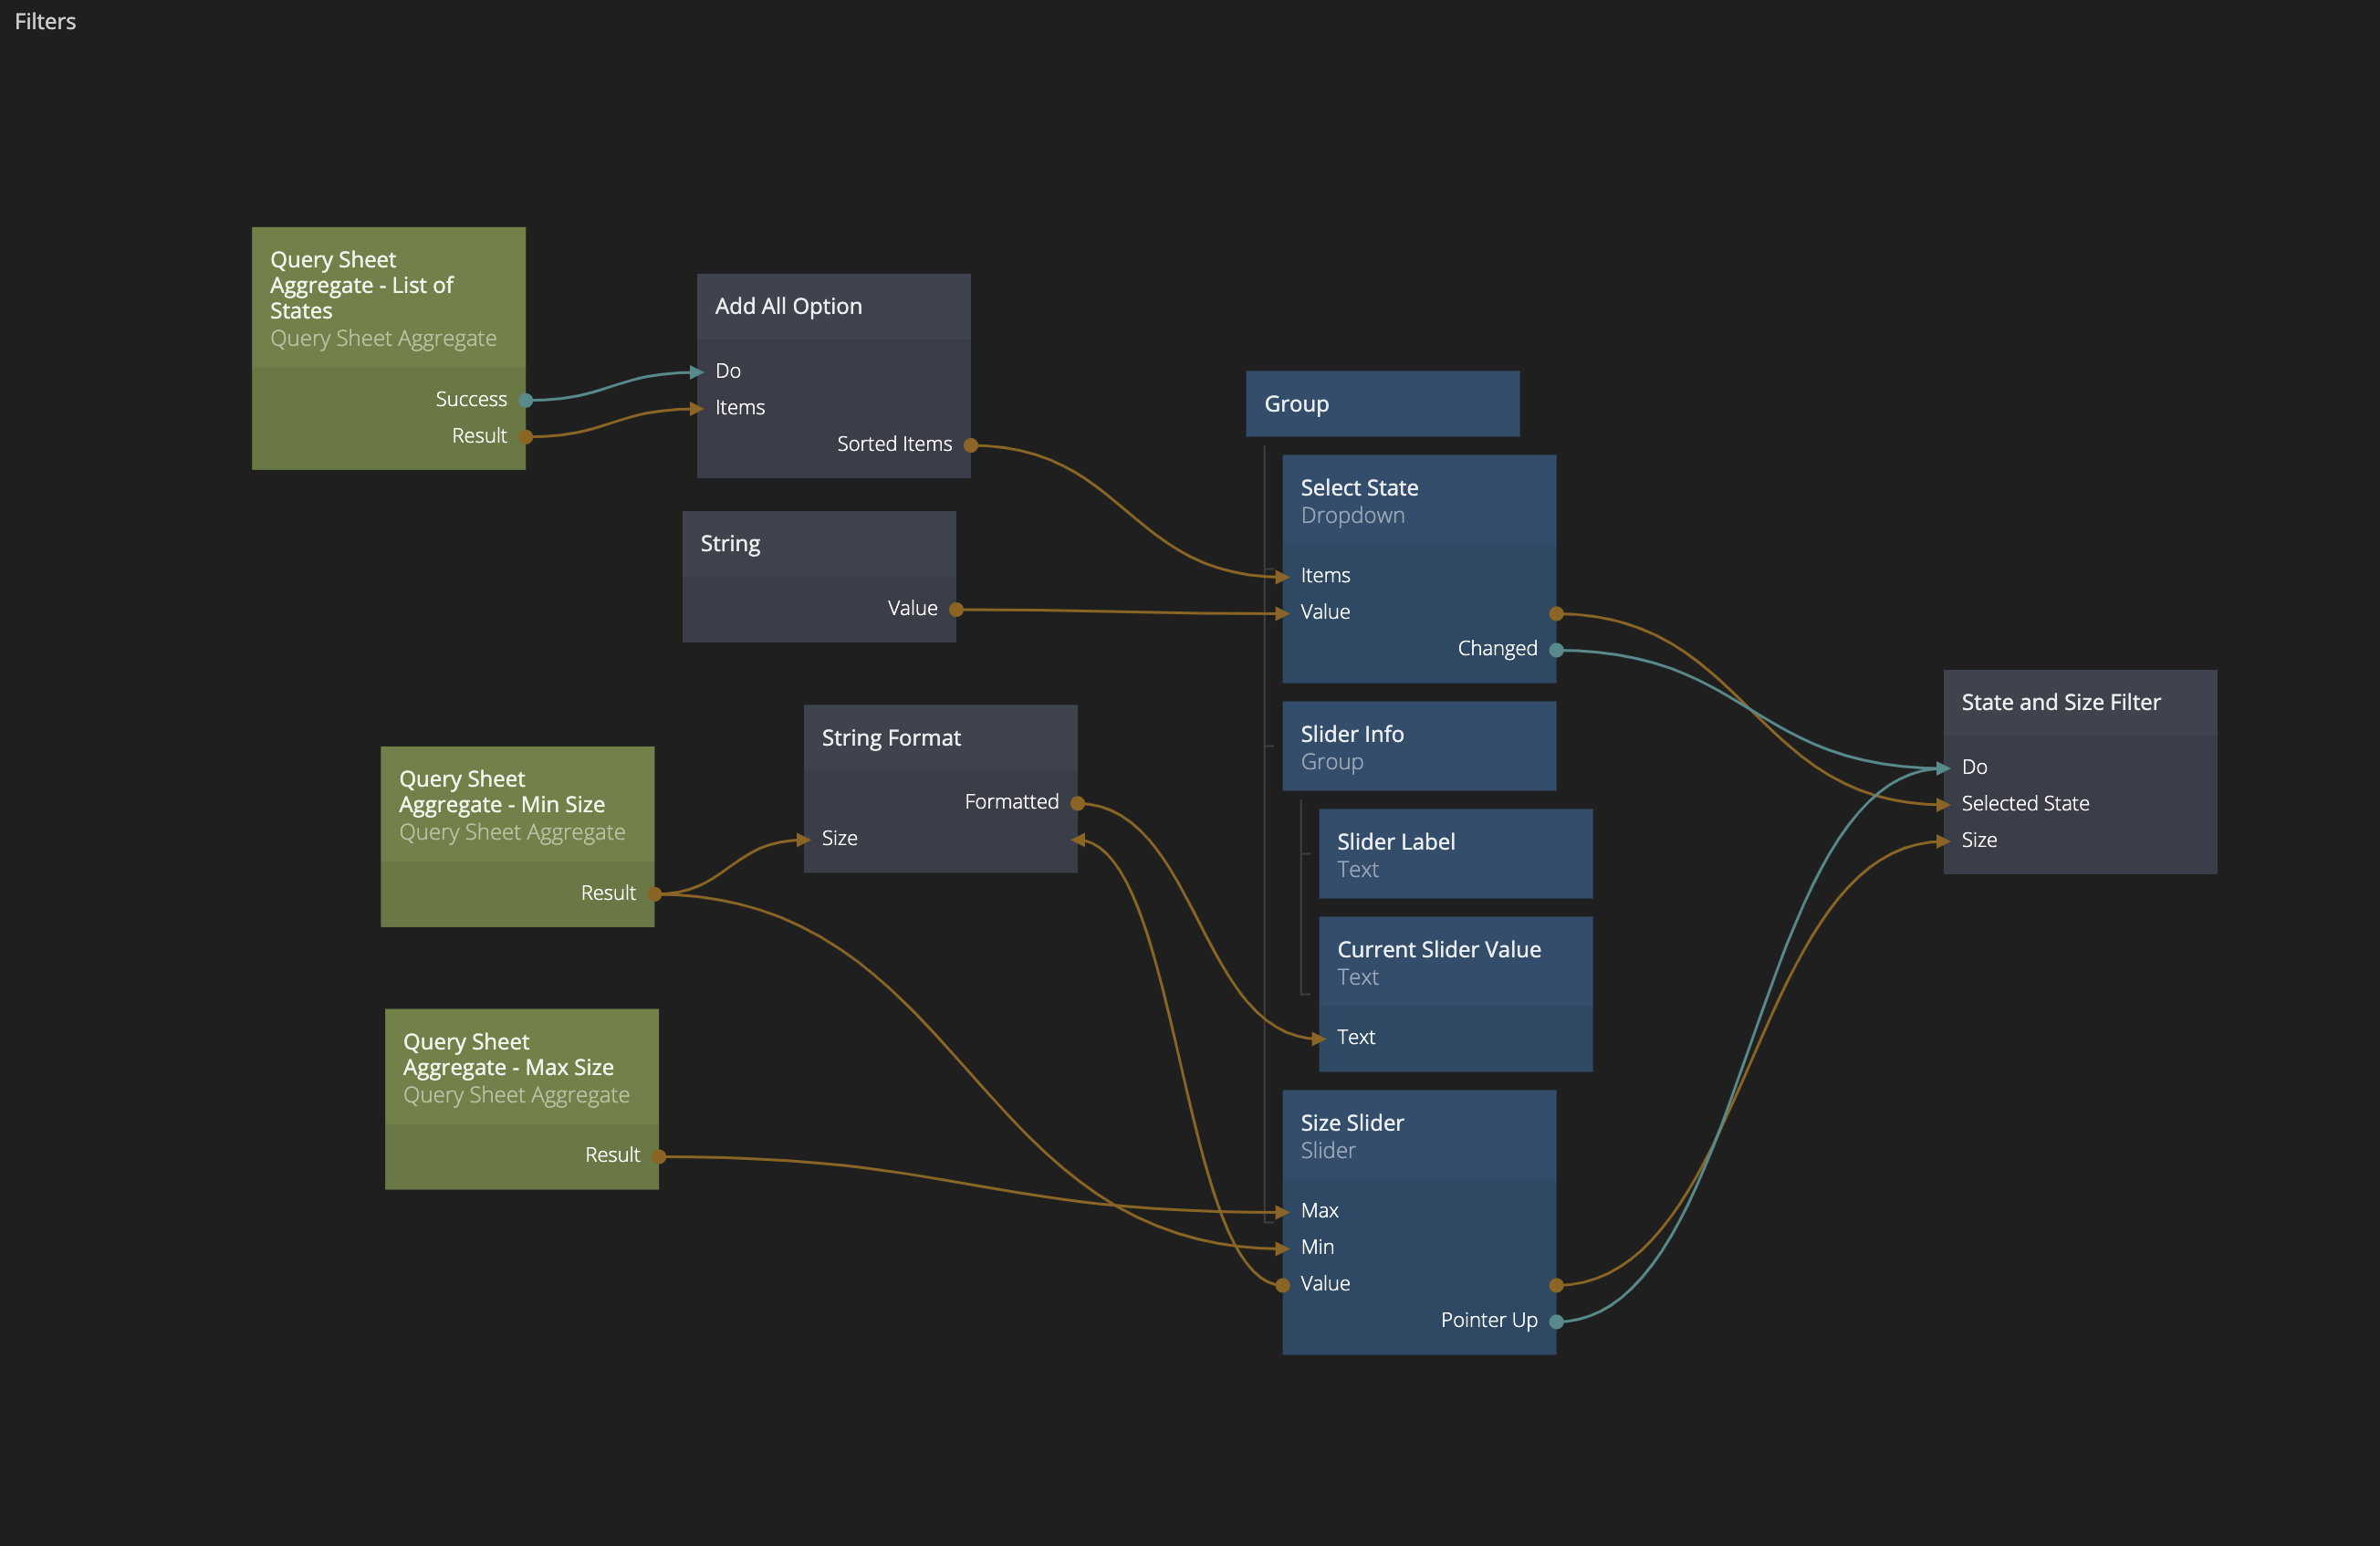
Let's select the Filters component again and finish building the visuals. The idea is that we should be able to filter the list of national parks based on which state they are in and/or what size they have. A Dropdown node would be a good pick for a UI element to select a state from, and to choose a size, a Slider node would be good to use. Add nodes to the Filters component so that you have a visual tree that looks like the image below. We will go through each node and it's properties next.
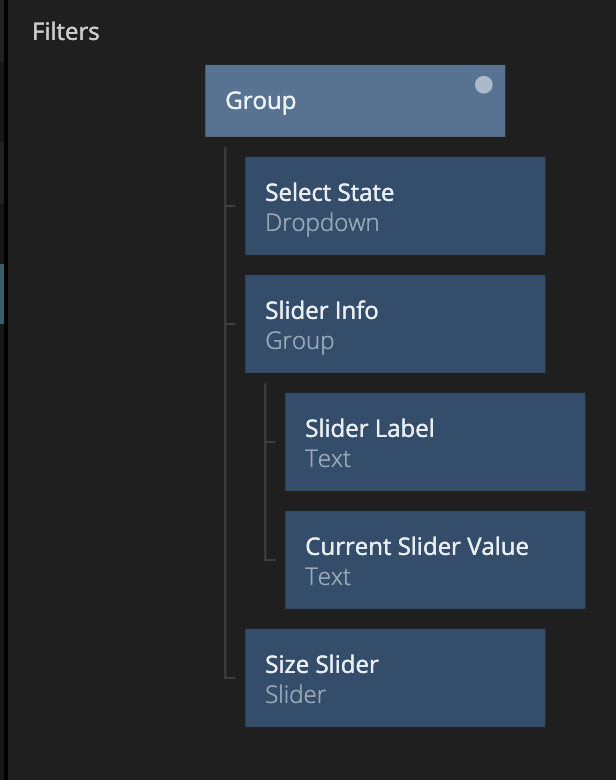
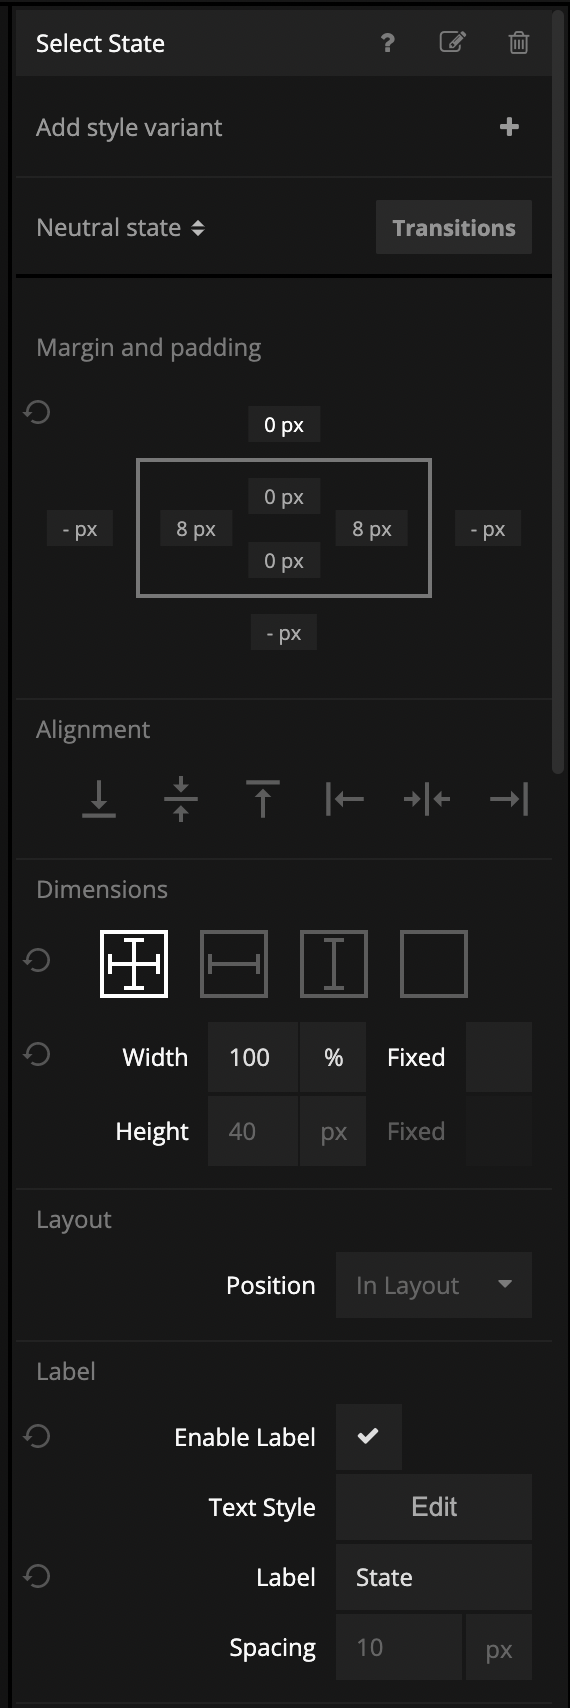
The Dropdown node that we will use to select which state to filter on has been styled as below:
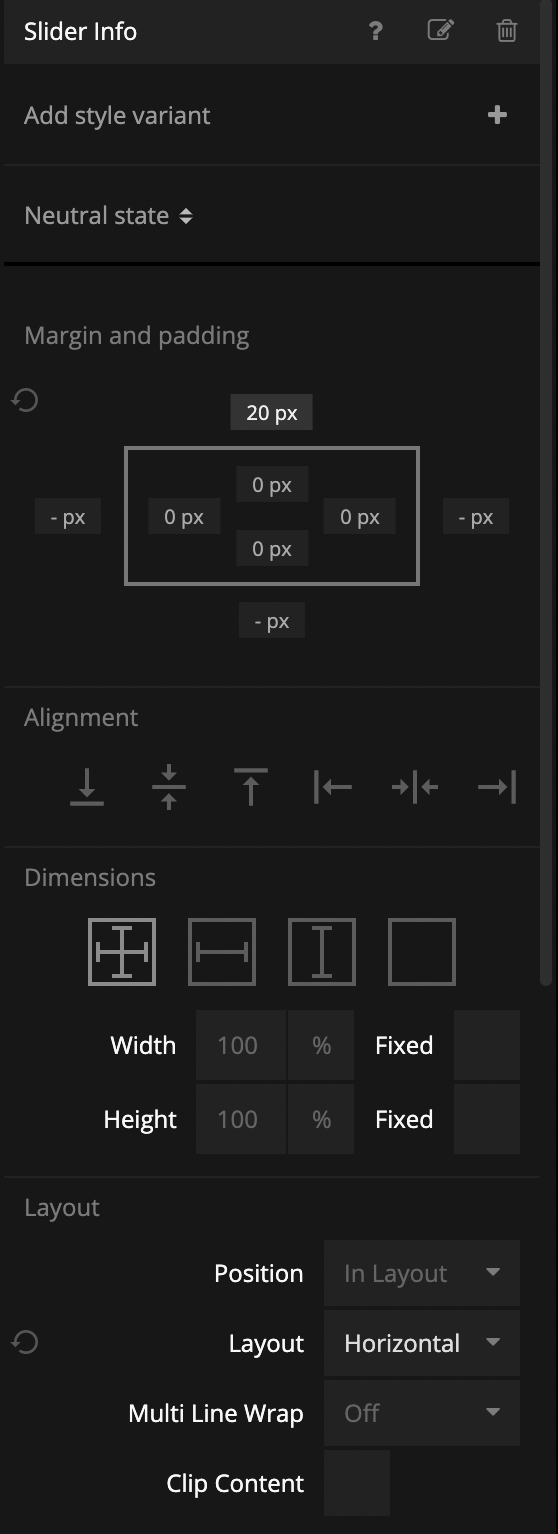
Next we have a Group node that holds two text nodes. The Group has been named Slider Info and it has the following styling:
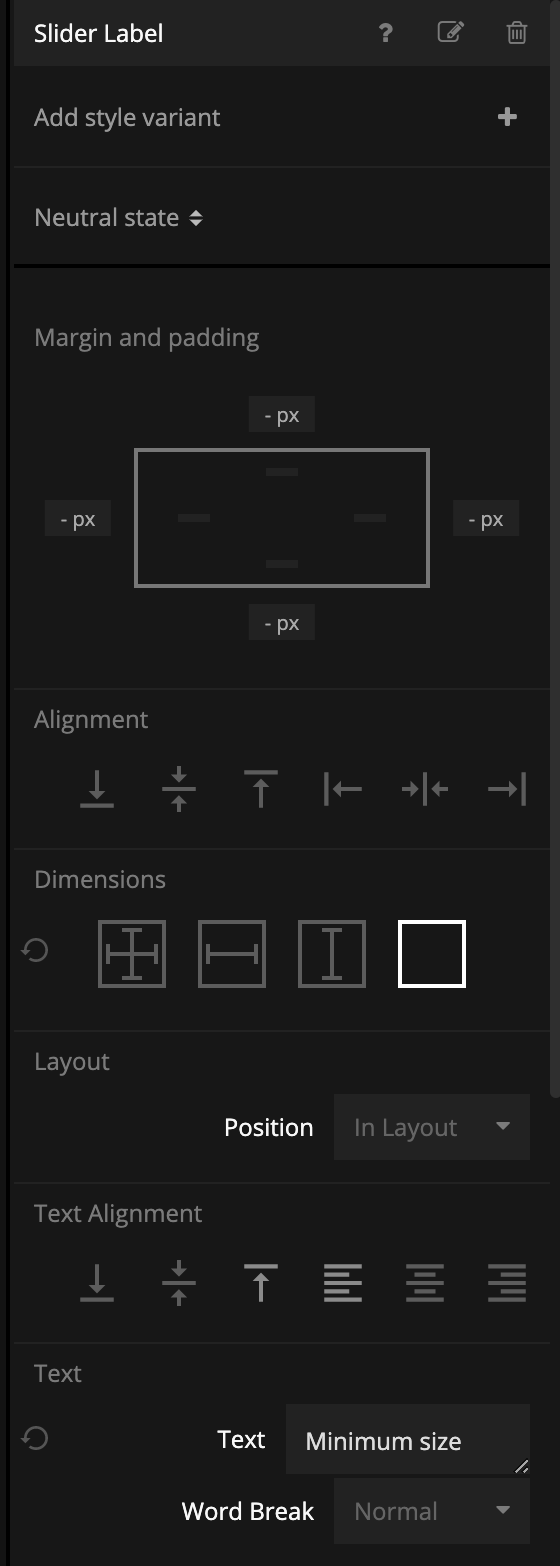
The two text nodes that follow have slightly different styling from each other. The first one is a Label for the Slider and it has the following styling:
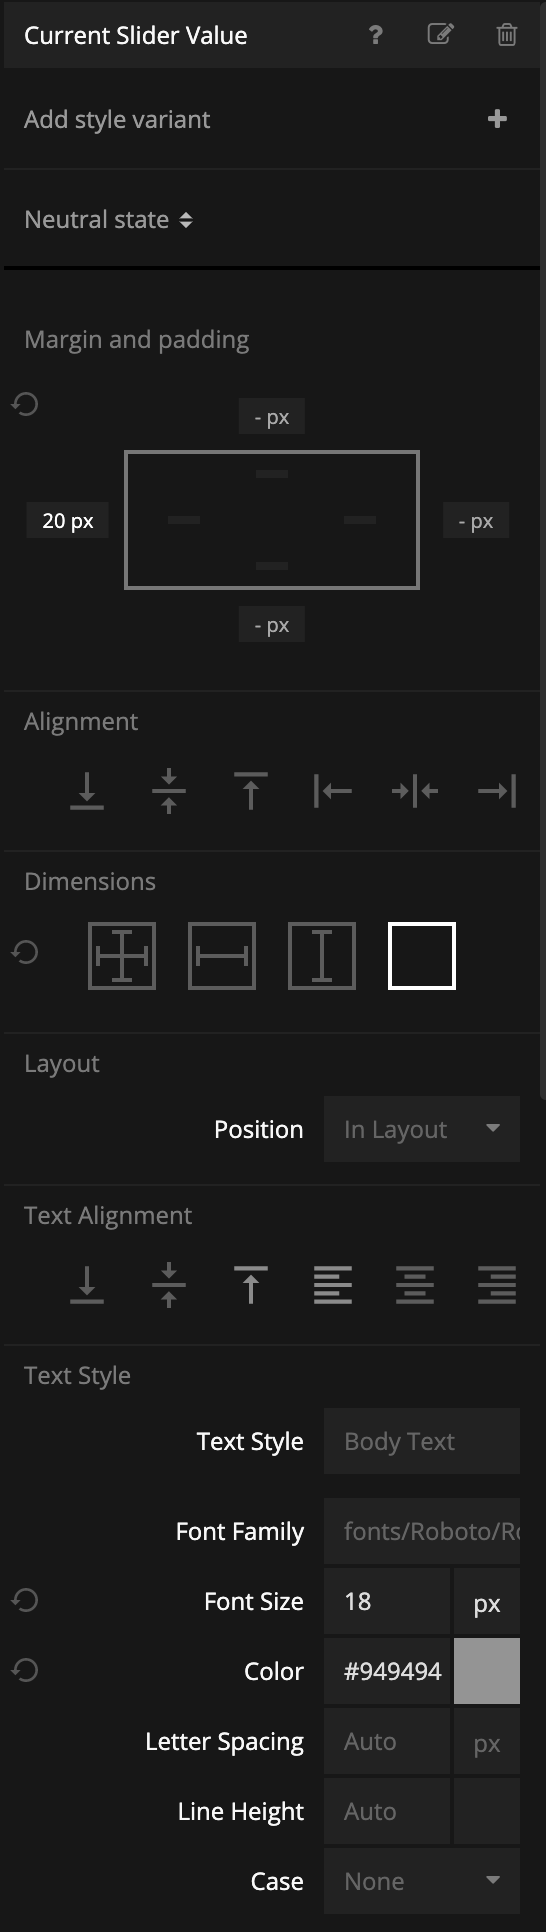
The second Text node that will hold the Current Slider Value looks like this:
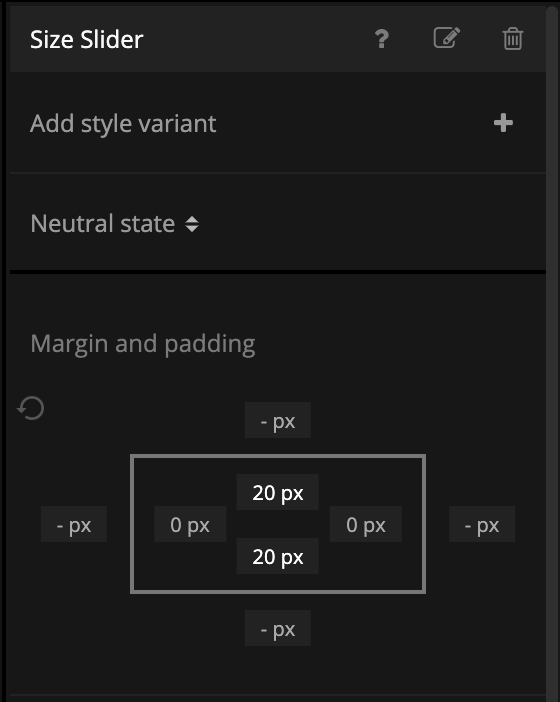
Lastly we have the Slider node where we have only changed the padding a bit:
Using Query Sheet Aggregate nodes to set the min and max value of the Slider
The Slider component will be used to set a number that we want to be between the smallest sized national park and the largest sized national park. In our Google Sheet we have a column for size so it would be cool if we could figure what the smallest and largest number is in this column. This is where the Query Sheet Aggregate node comes in. This node is used to do aggregate data queries on a column from a public Google Sheet which is exactly what we are after here.
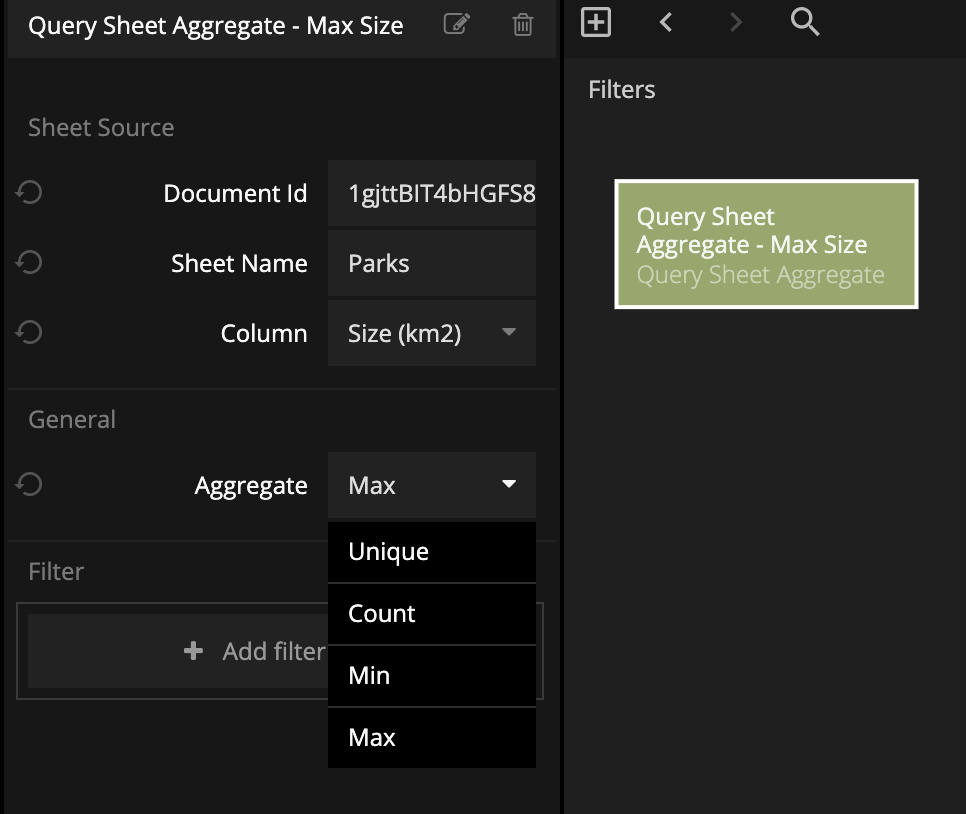
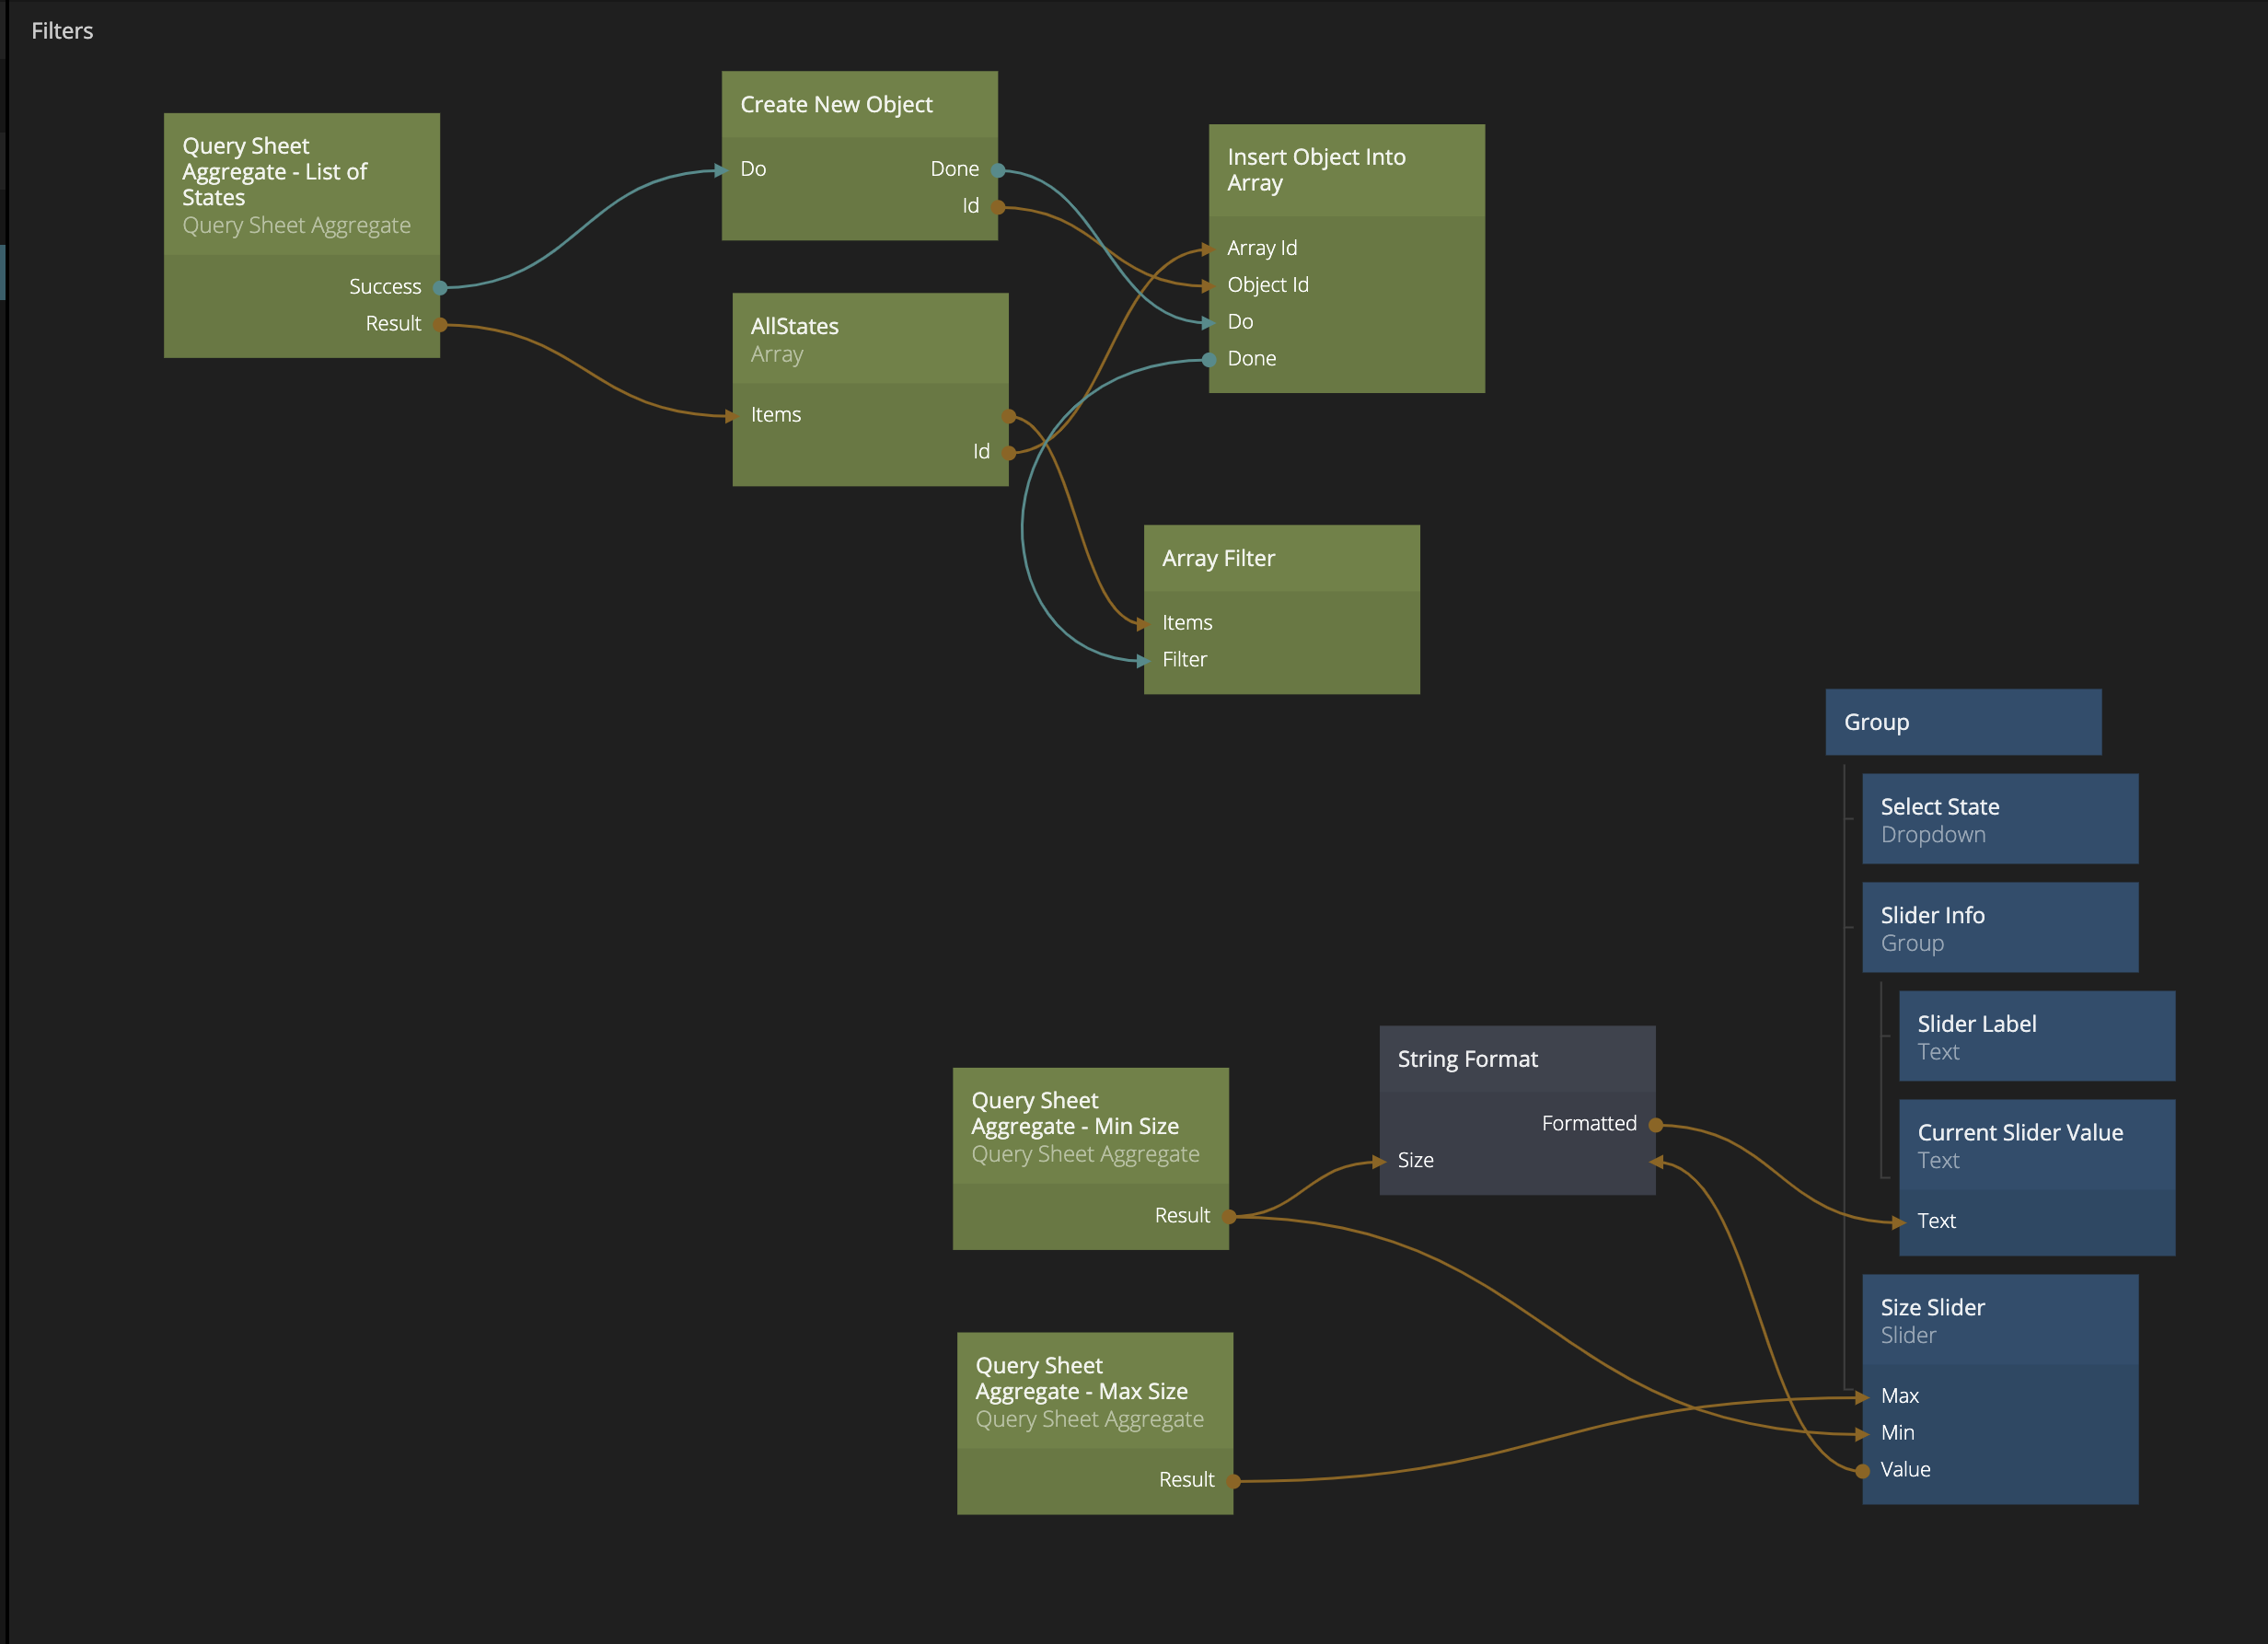
Let's first add a Query Sheet Aggregate node to our Filters component, and fill in the following properties:
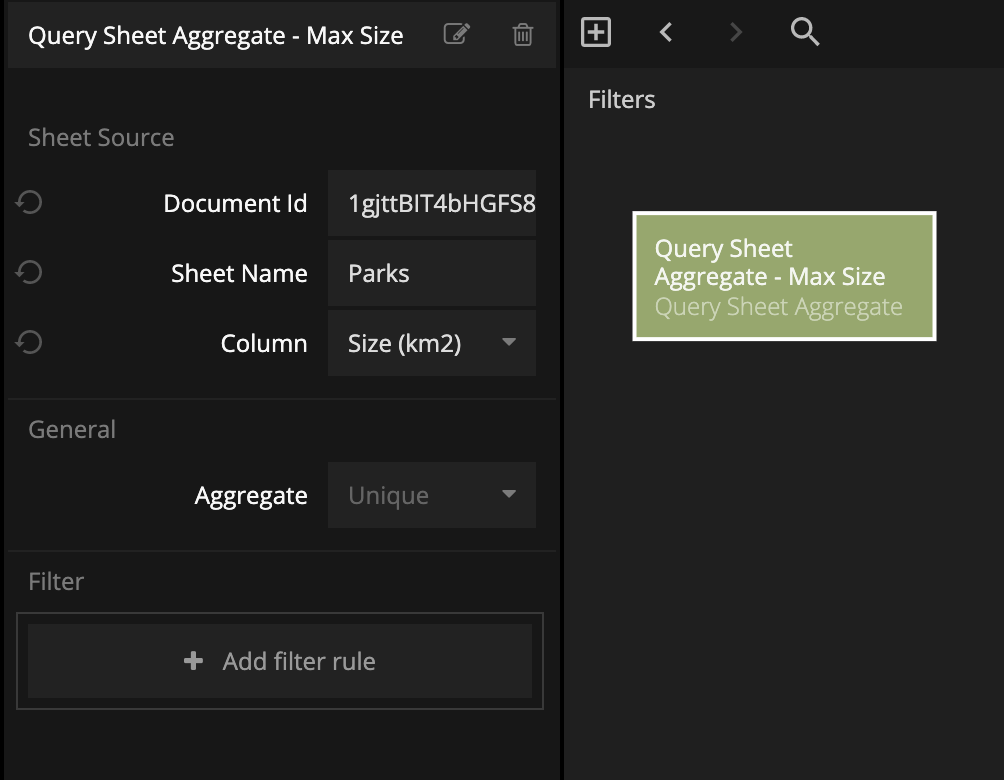
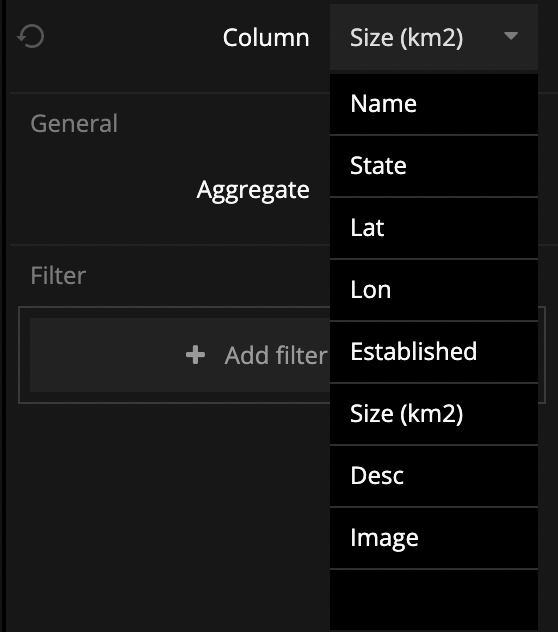
As you can see we need to tell the node which Google Sheet document it should look at (Document Id: 1gjttBIT4bHGFS8ynF31DoYw143ZY3UAiwopAW0N97KQ) and which sheet in that document we are interested in. Once the node has that information it will present a list of all the columns that the specific sheet has. Here we want to pick the Size (km2) column, and then we can choose how we want to aggregate the data of that column. We want to set up a Slider with a minimum and maximum value, so let's select Max to get the maximum value of the Size (km2) column.
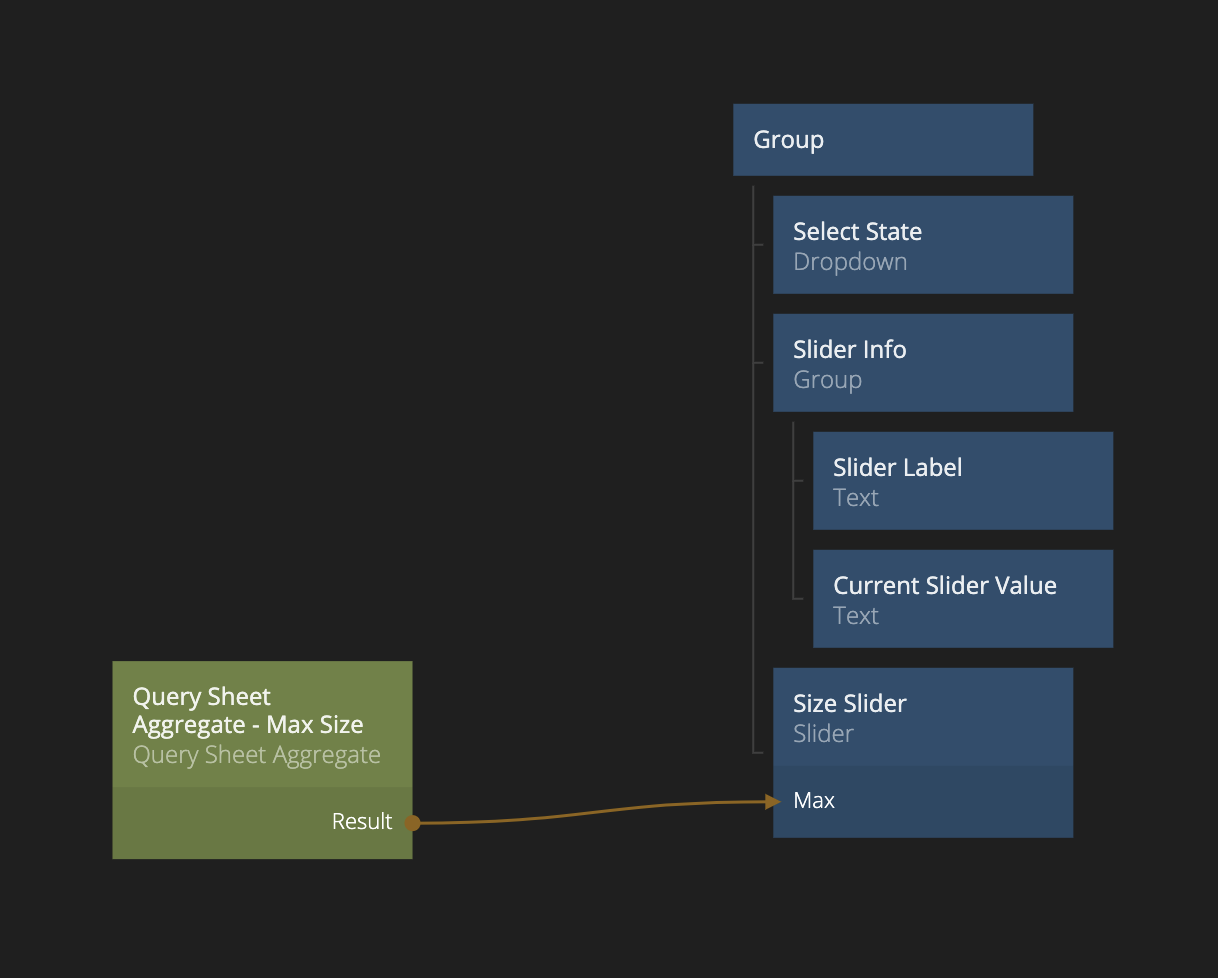
Then we connect it to the Slider like this:
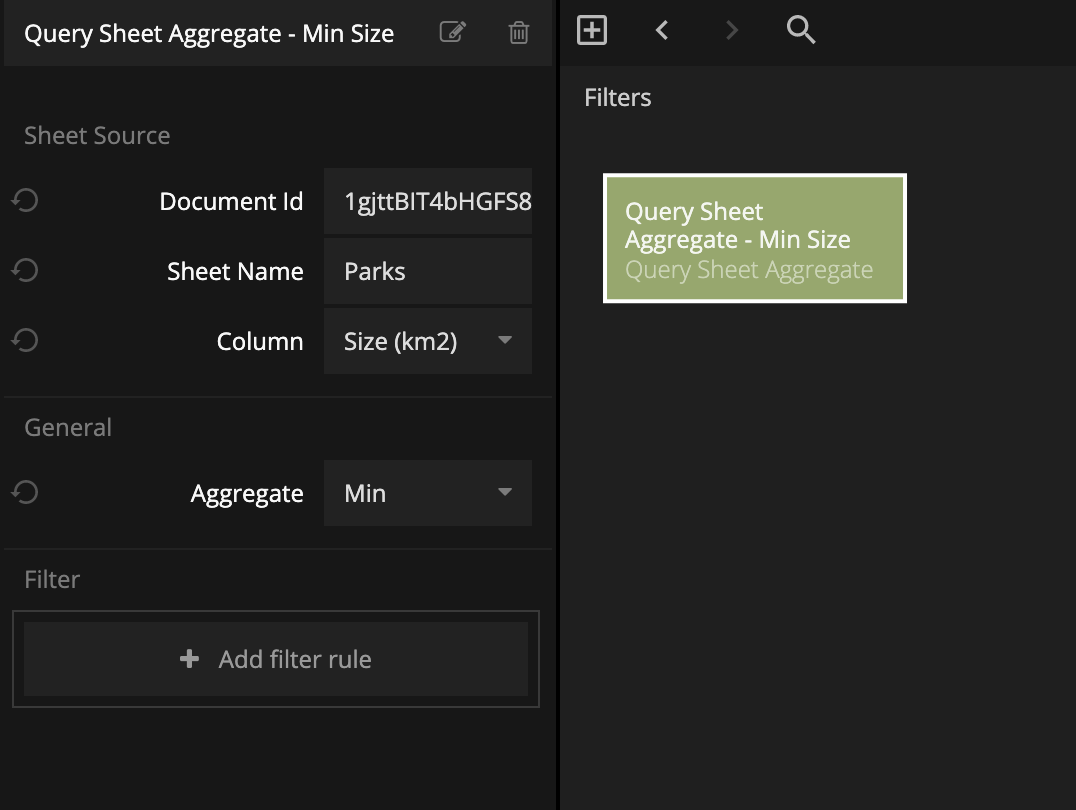
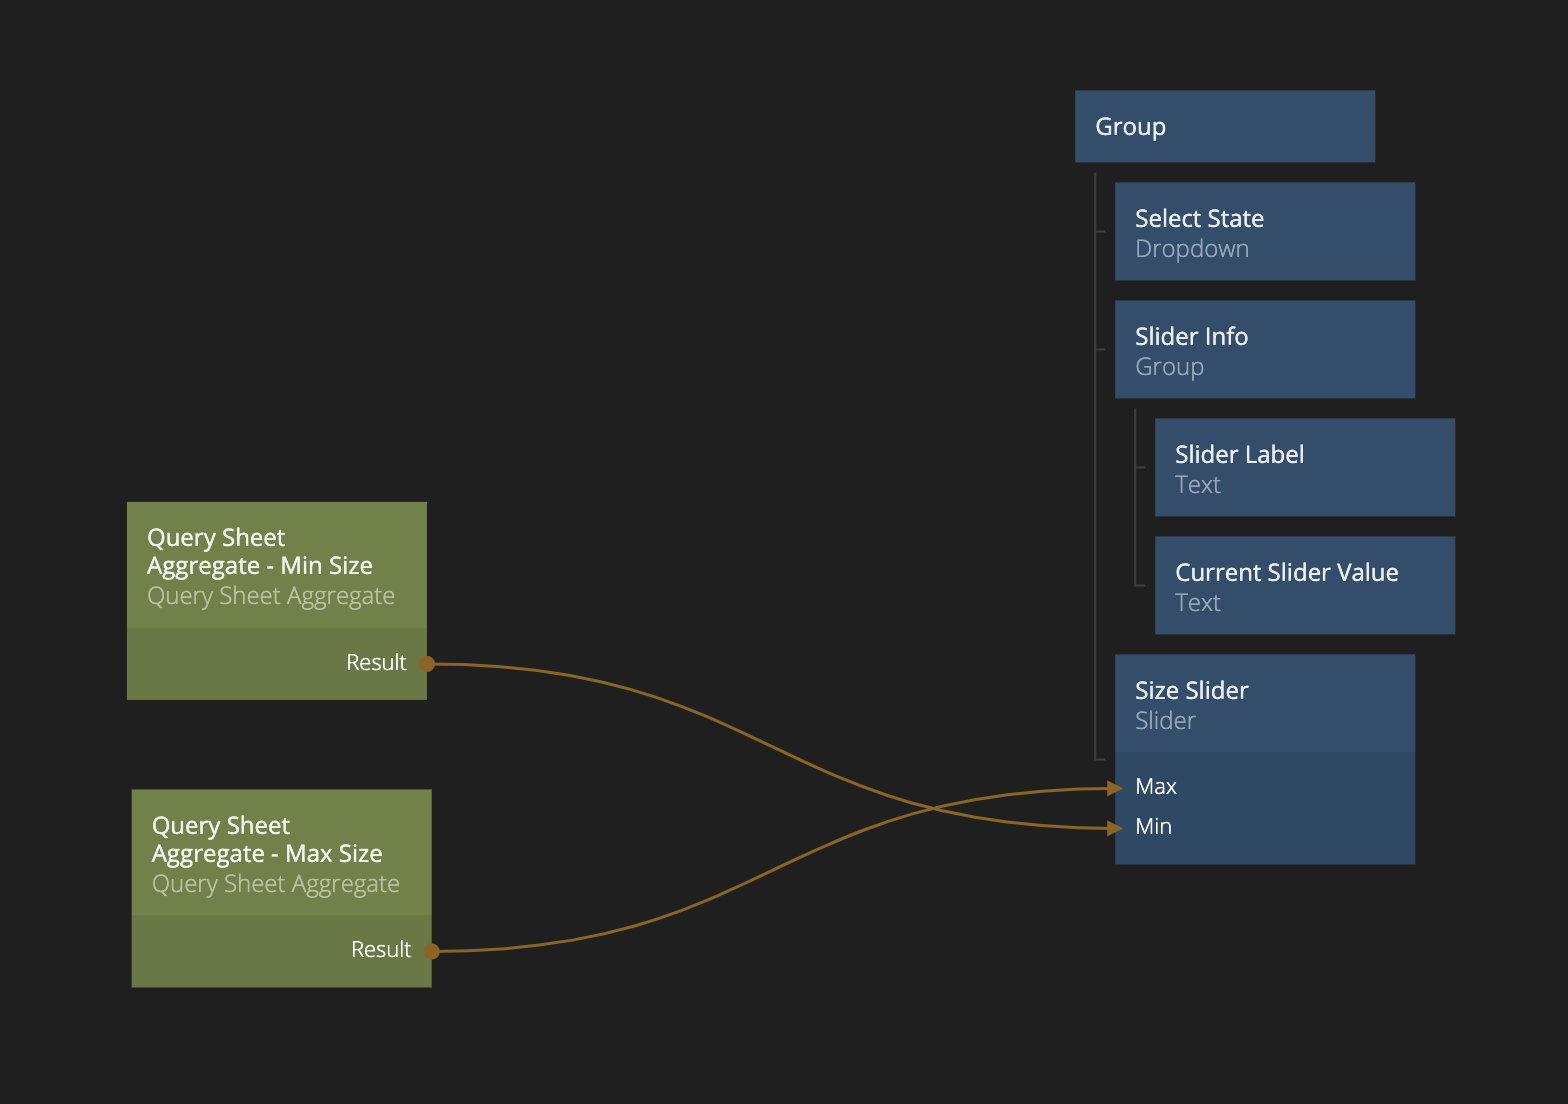
Now we need another Query Sheet Aggregate node to get the minimum value so let's add one and set it's properties as follows, and also hook it up as in the second image:
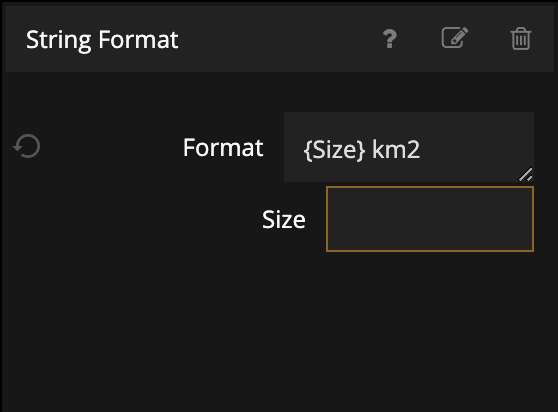
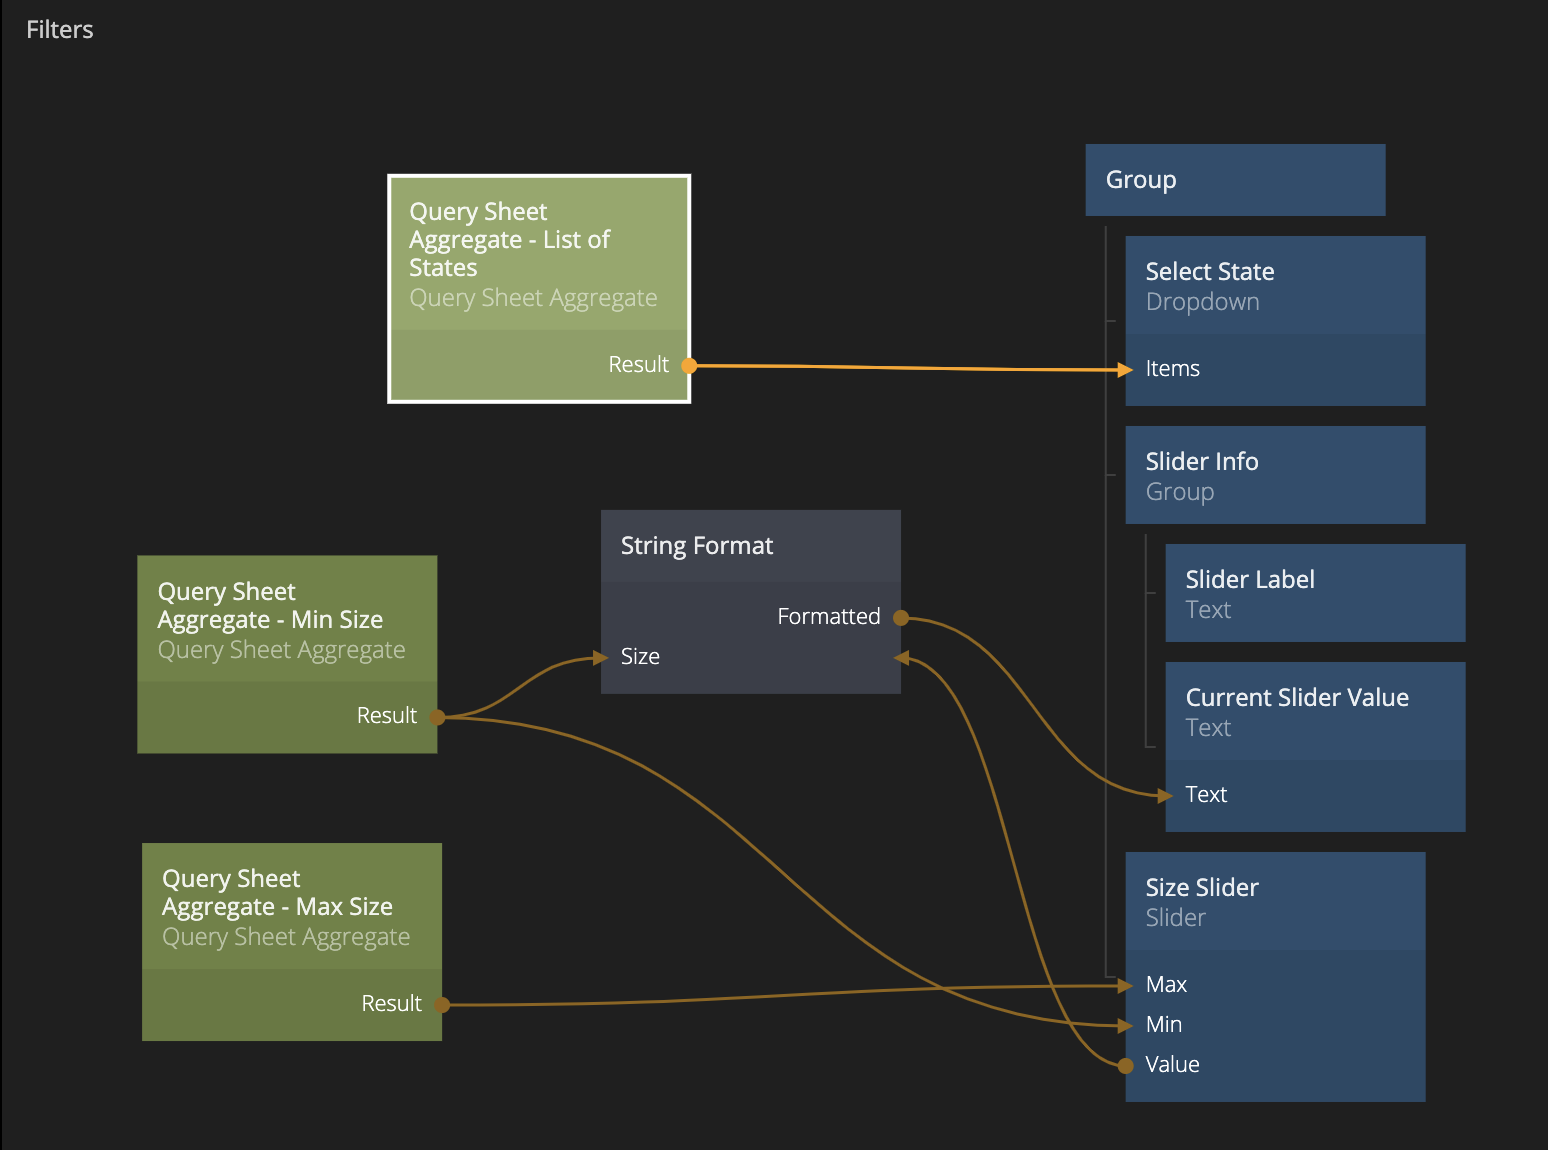
Now the Slider has it's min and max value set, so let's now make sure that we show the current value of the slider in our Current Slider Value Text node. It would also be nice to show that the number is in km2 so we will add a String Format node and set it up like this:
Then let's connect everything like this:
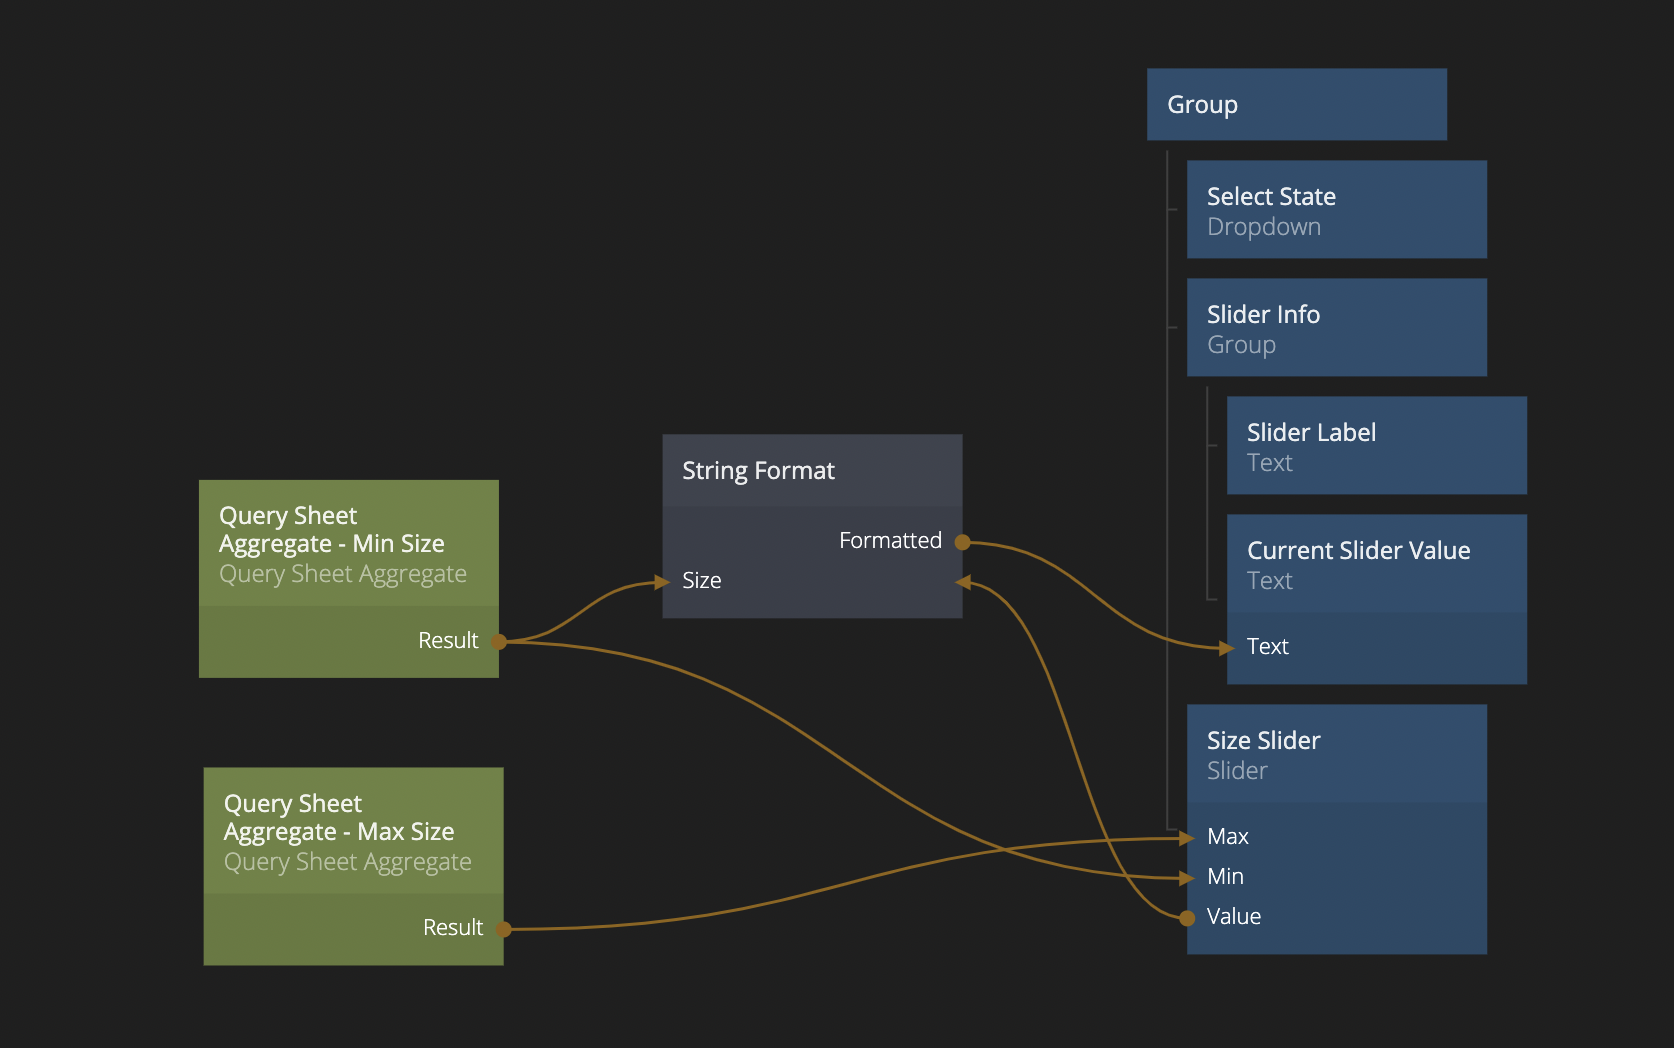
The reason we hook up the result from the Query Sheet Aggregate - Min Size, is so that we show the initial slider value when we first open up the Filters component. The Value output from the Slider only updates as we interact with the Slider so the initial value needs to be set from the Query Sheet Aggregate - Min Size.
Getting a list of all states
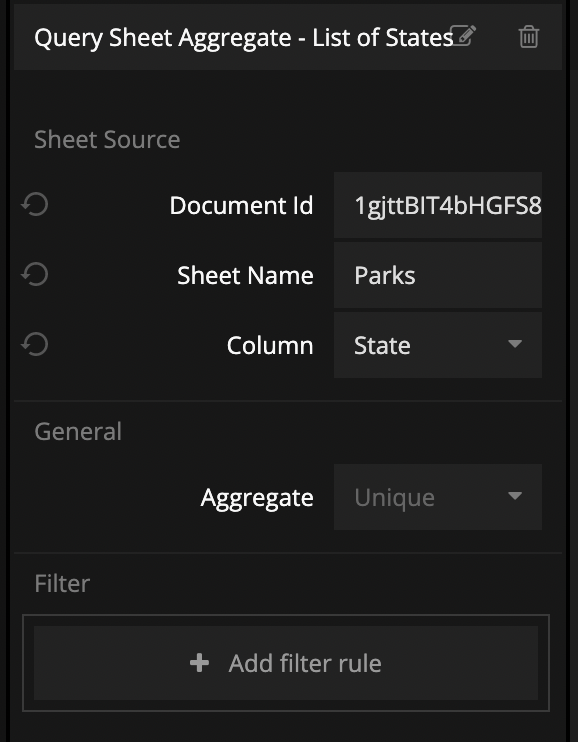
Now that we know how to use the Query Sheet Aggregate node, let's use it again, to get a list of all states that are in our Google Sheet for US national parks. This time we will set the Aggregare property to unique which means the node will return an array of all the unique values from the states column.
?> Note that some parks span two states, e.g. the Great Smoky Mountains are in both North Carolina and Tennessee. We have chosen to treat North Carolina, Tennessee as it's own option in the states list. A different solution would be to have two entries for Great Smoky Mountains, one for each state it's in.
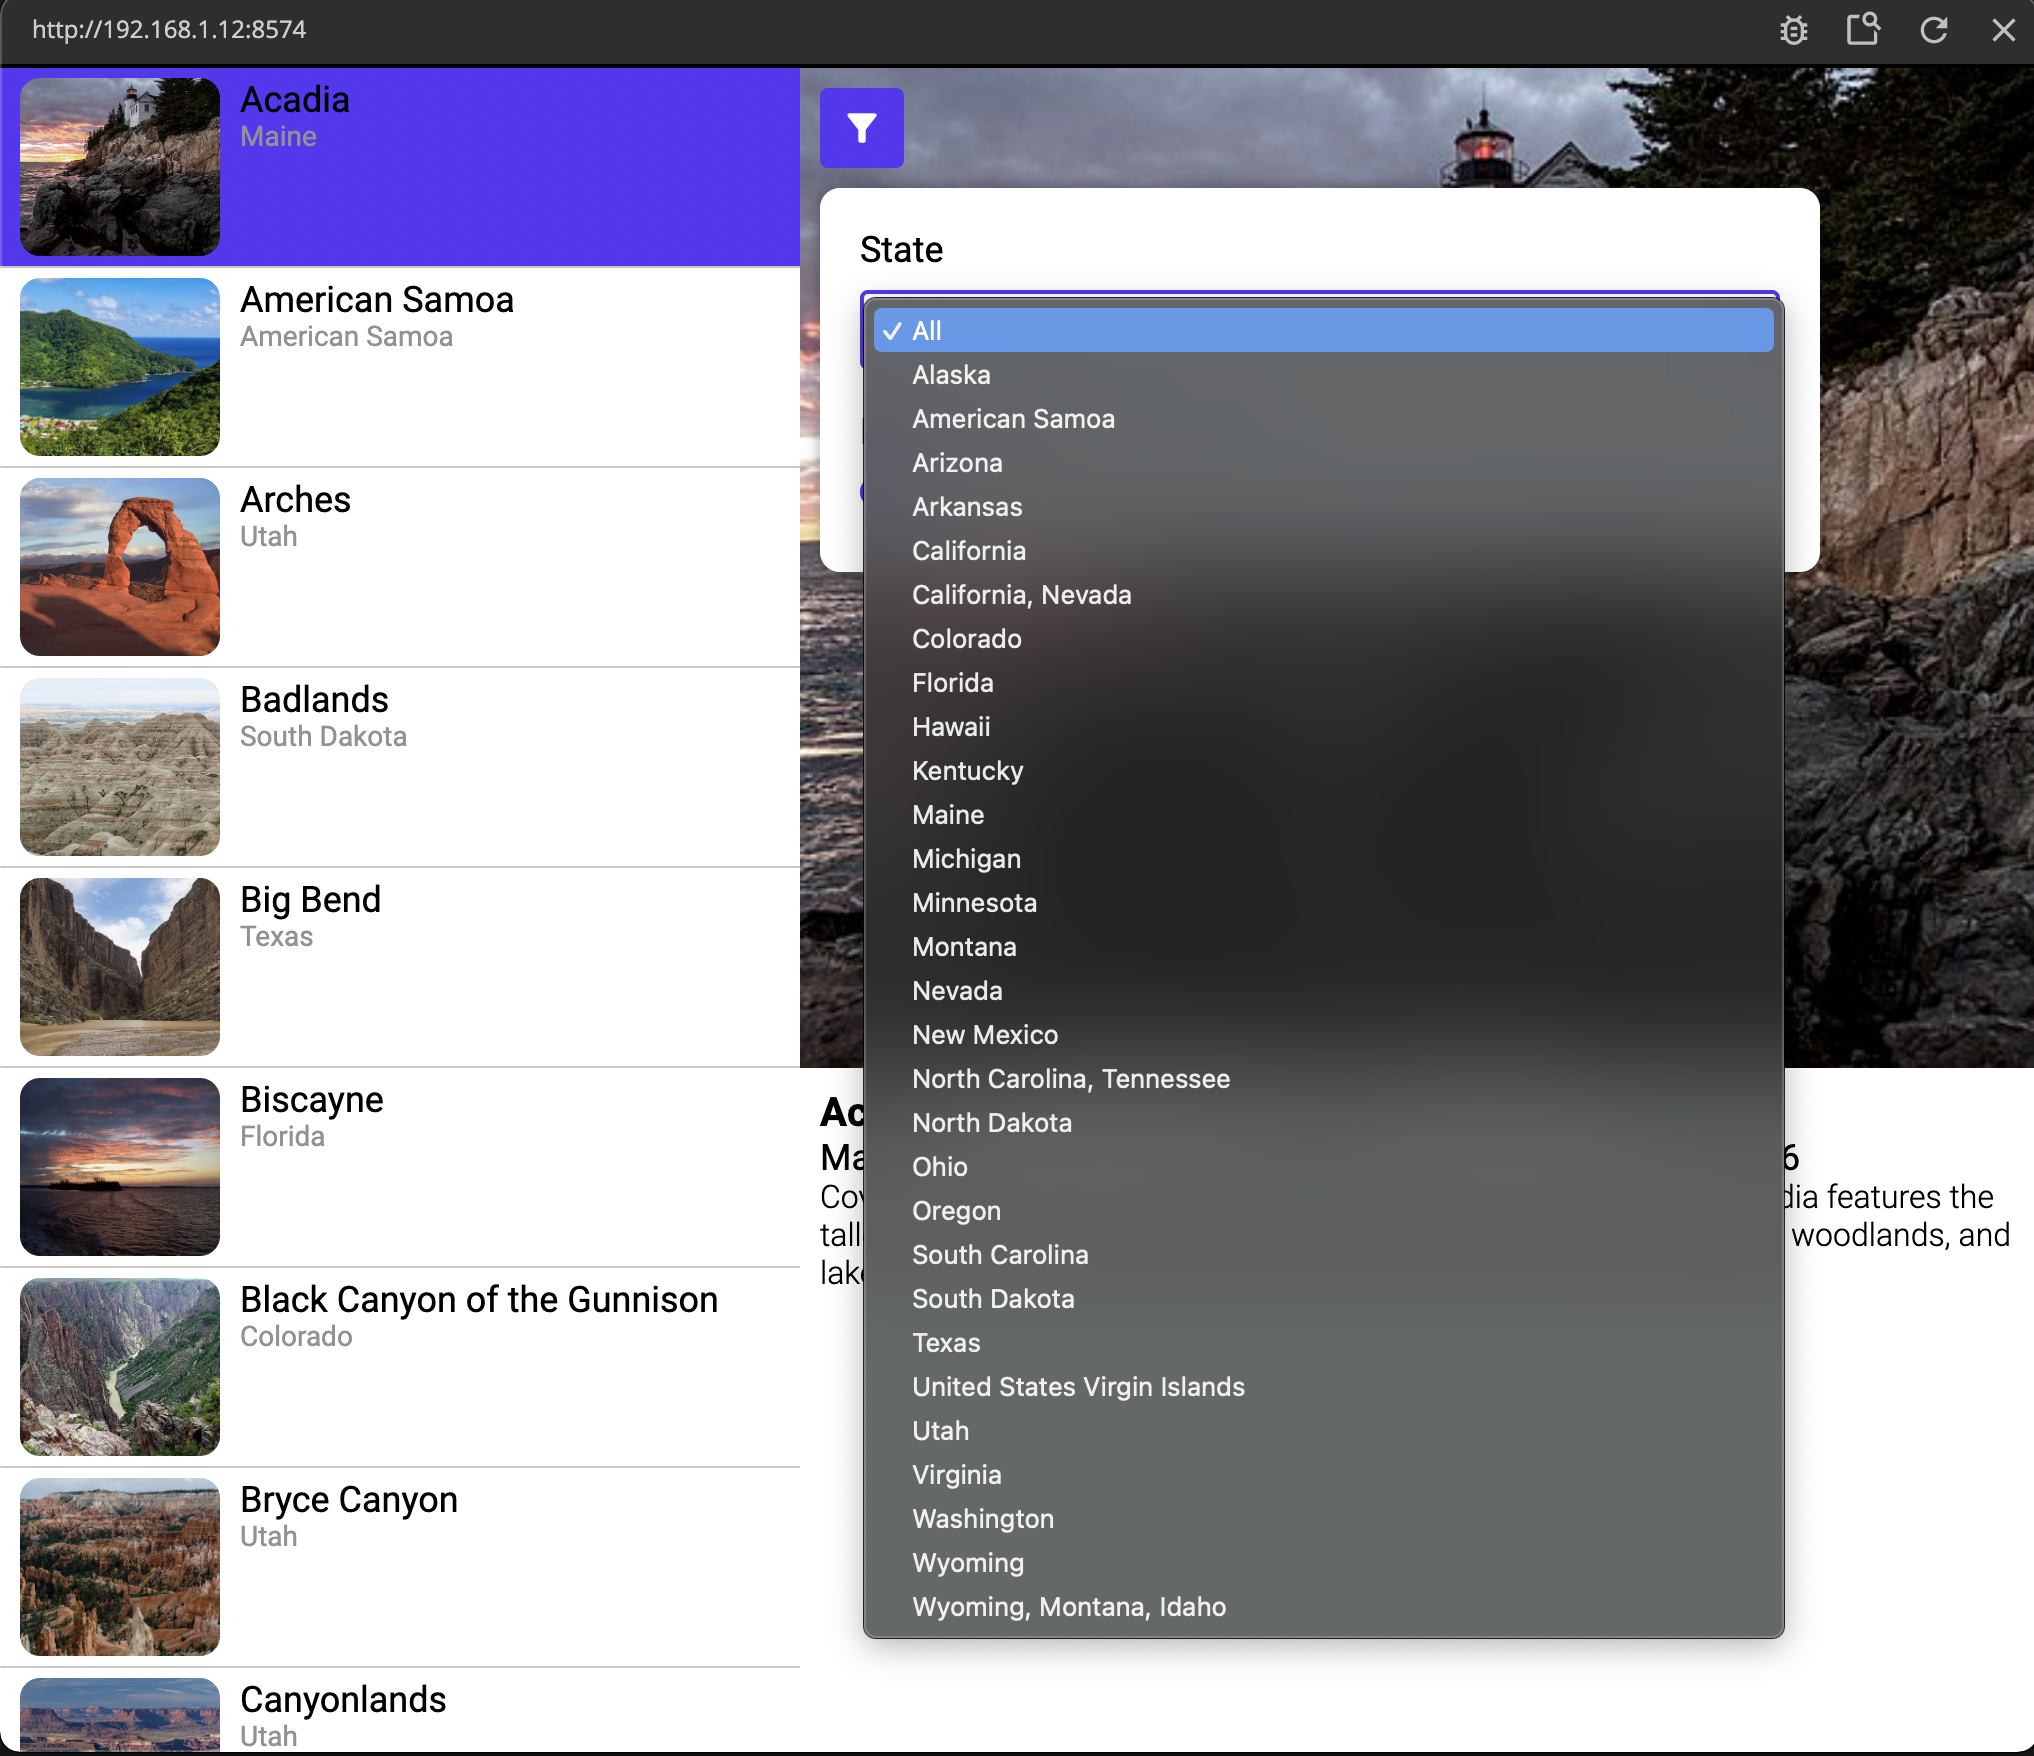
Let's connect it to our Dropdown node, and then click on the Dropdown list in the preview.
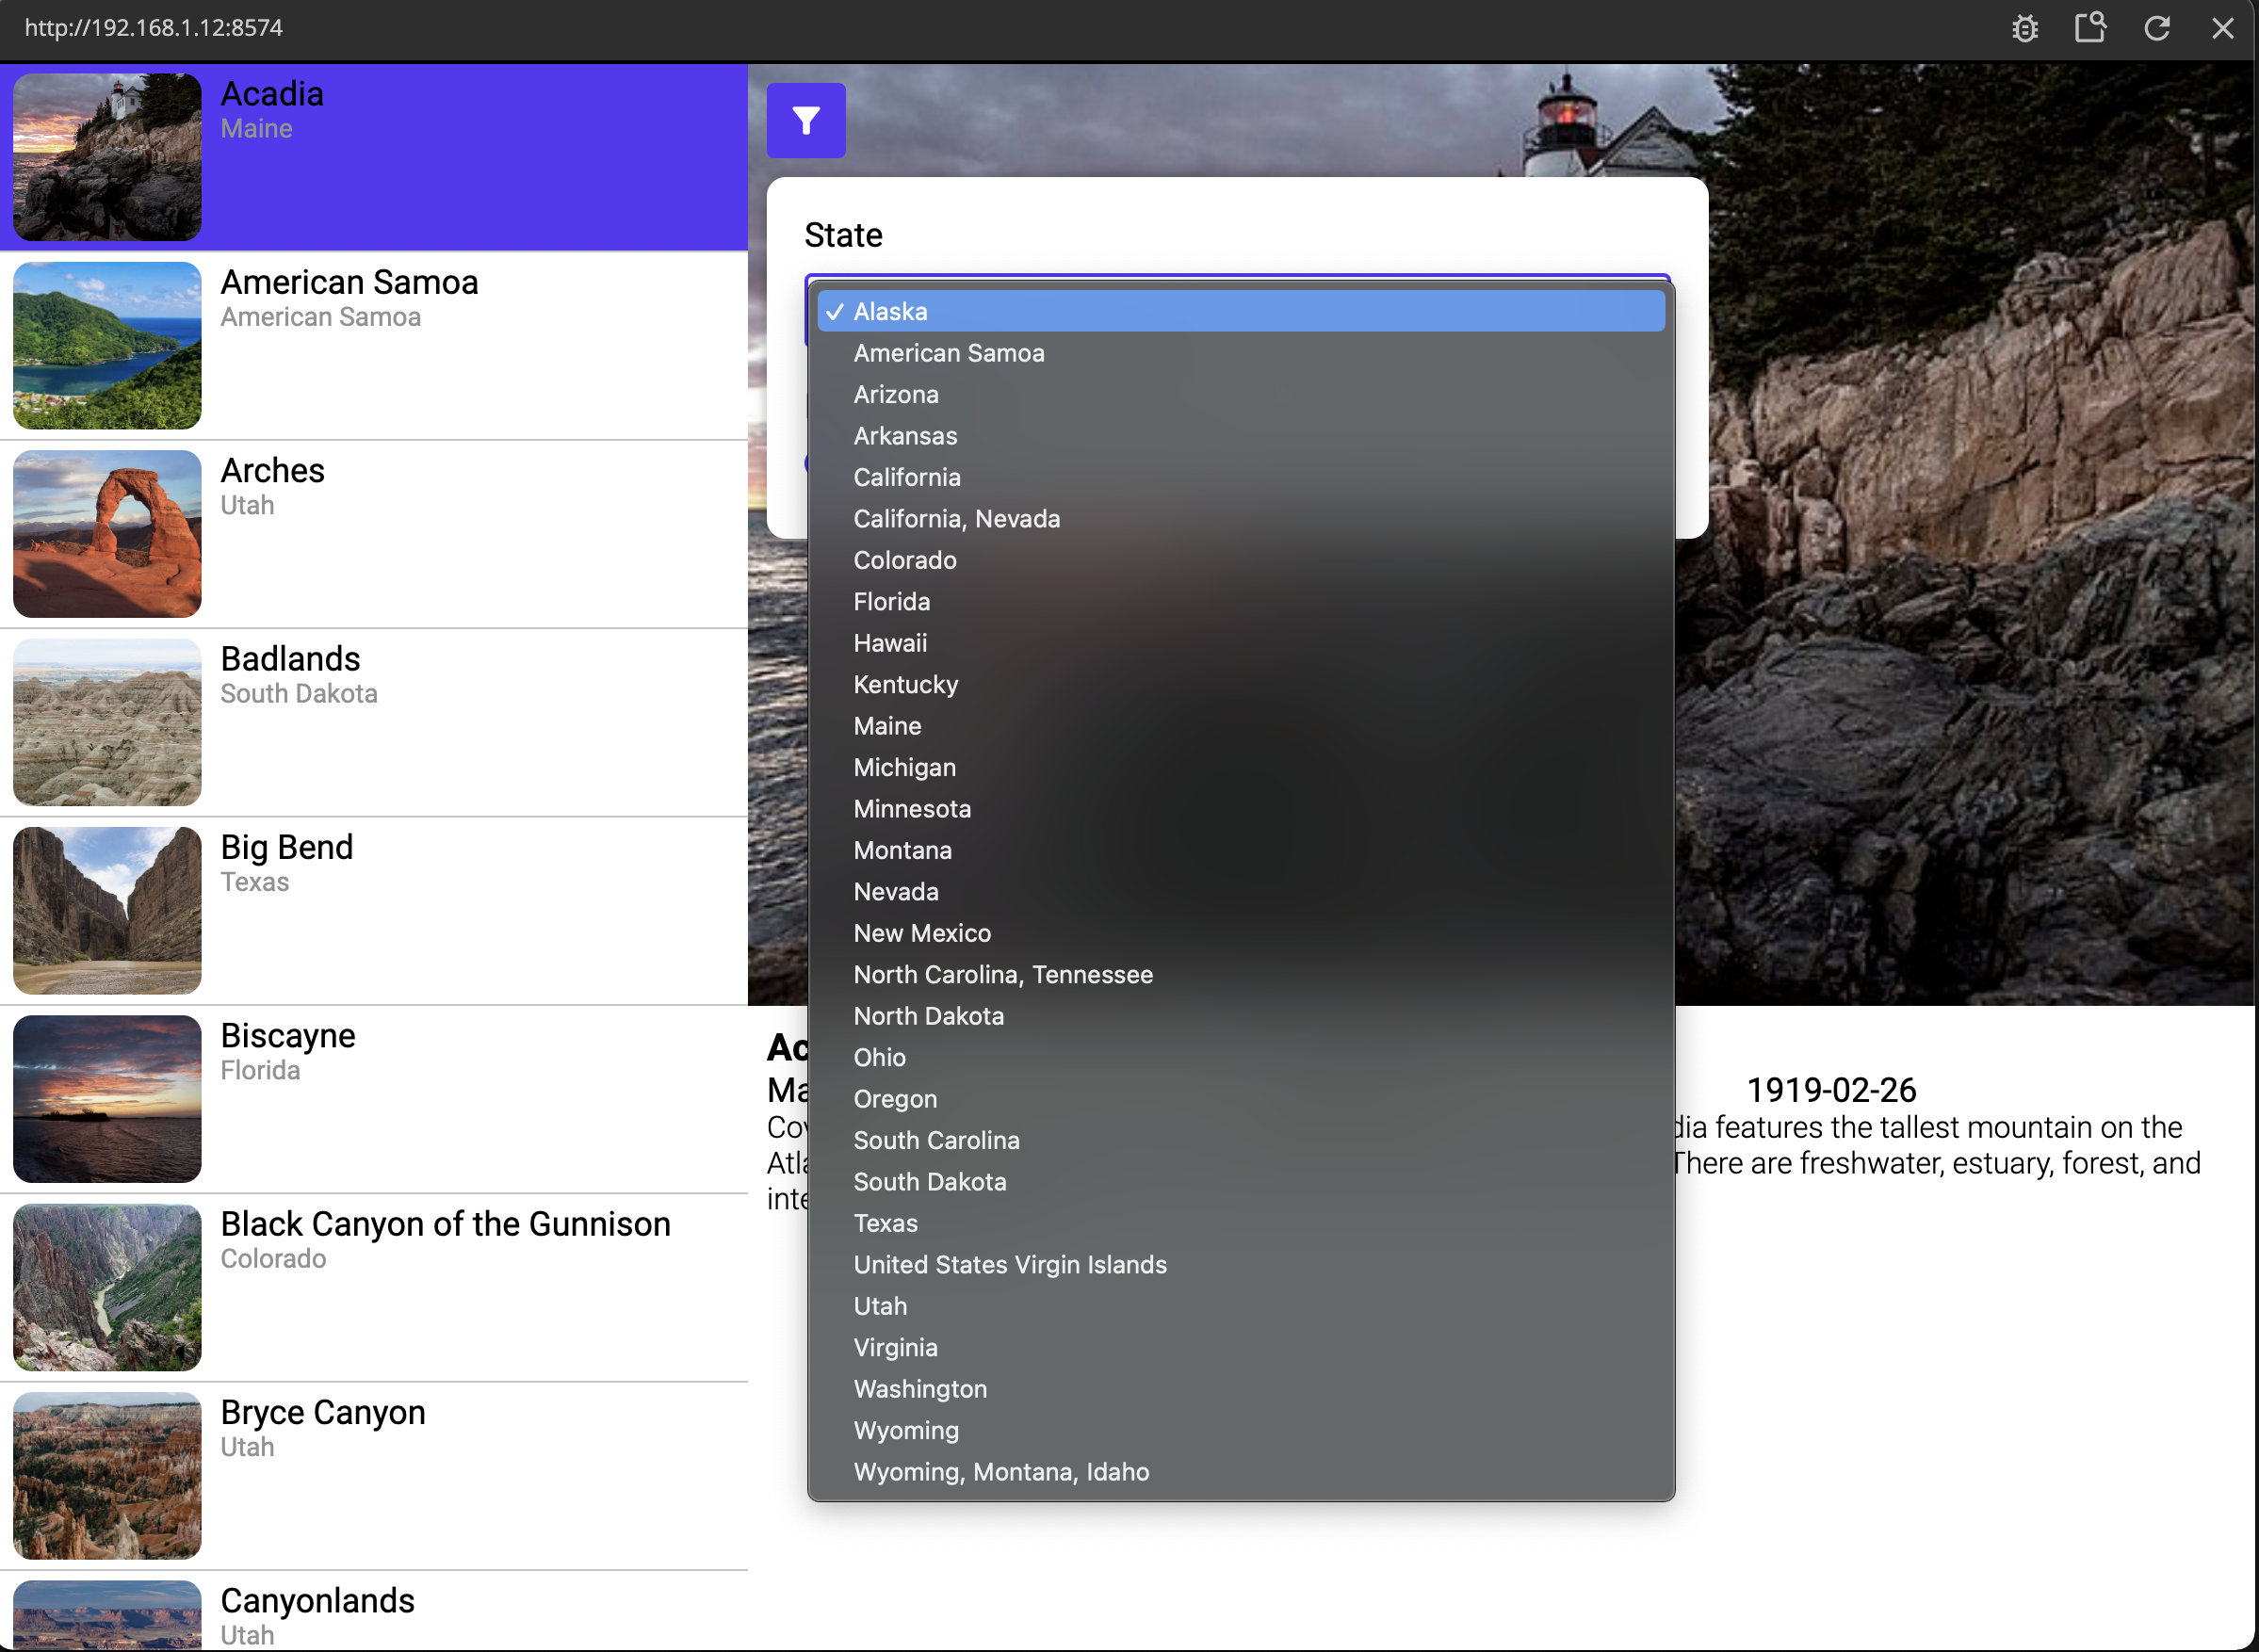
This looks pretty good, but there is one problem. There is no option for selecting All states which is the initial state of our list. To solve this, we need to add another option to the array of states.
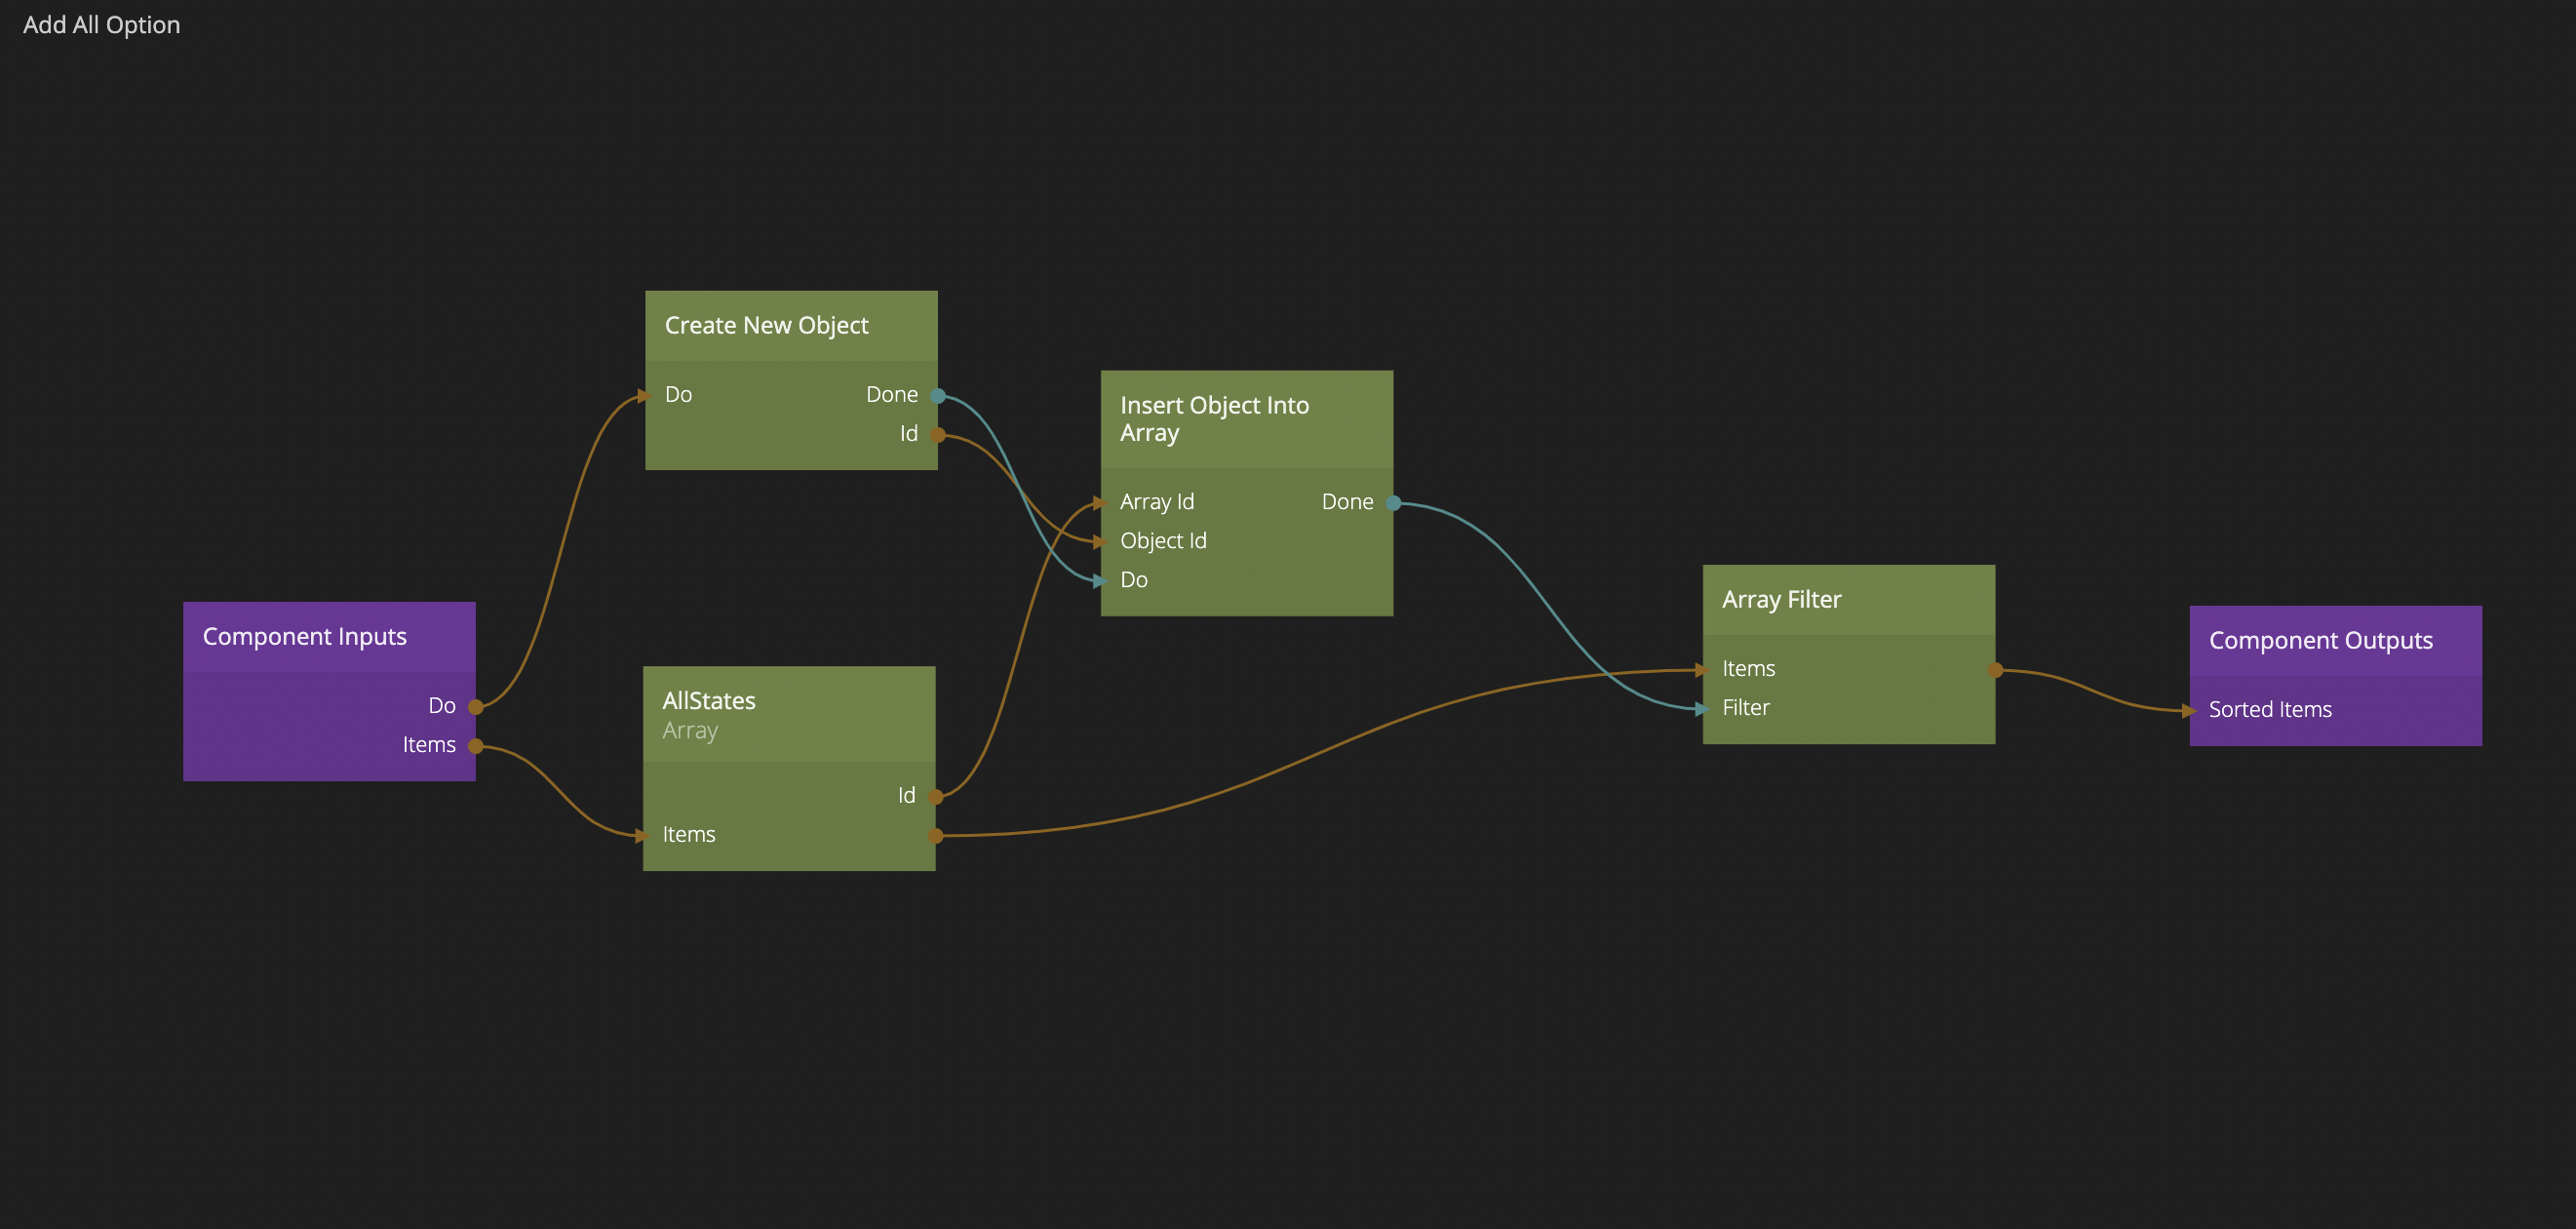
Adding All option to states Dropdown
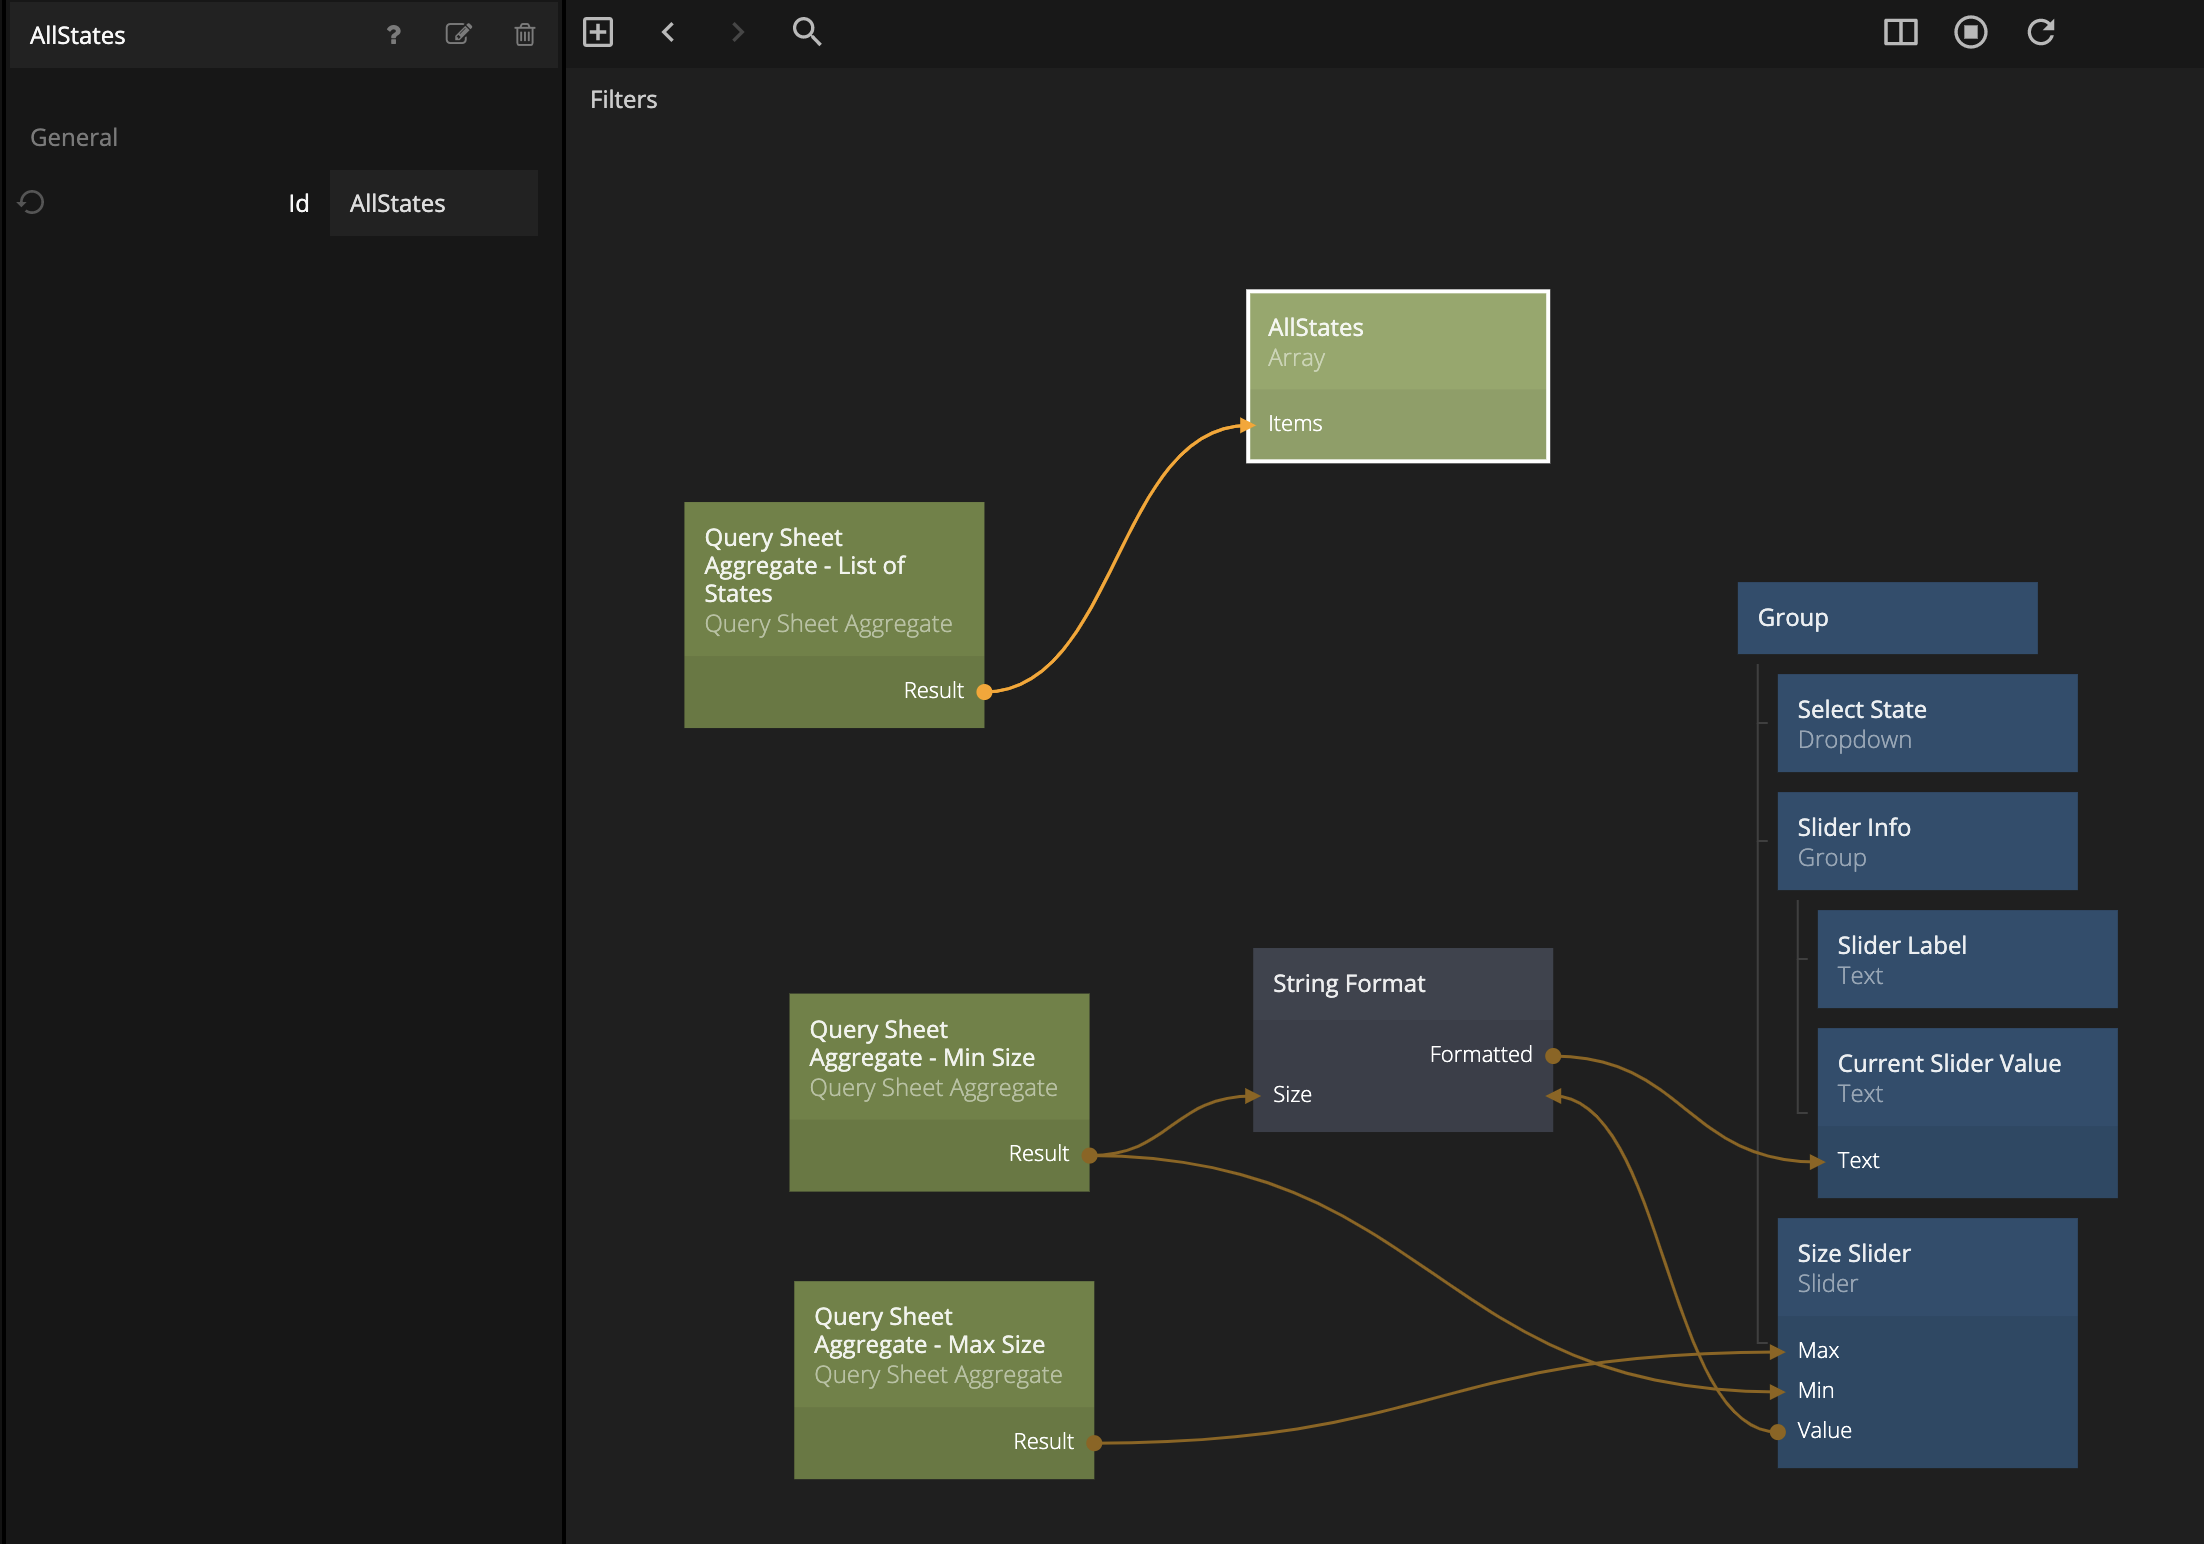
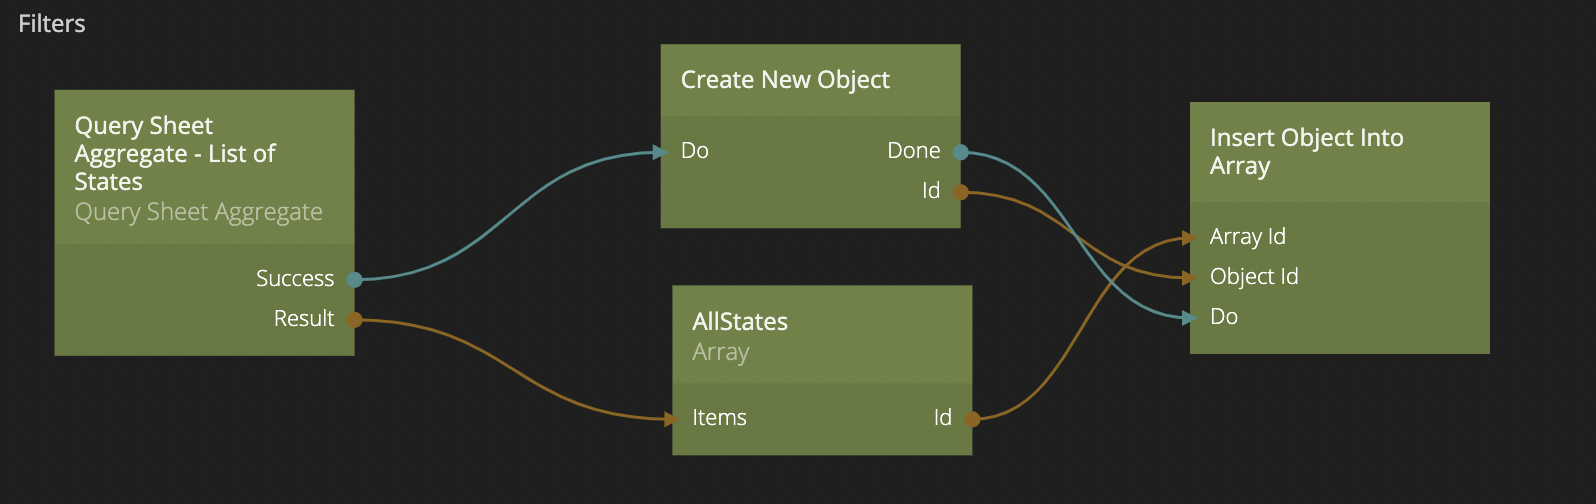
The result we get from the Query Sheet Aggregate - States is an array of items, so let's create a new Array and call it AllStates and then connect the result from Query Sheet Aggregate - States to the Items input of the Array:
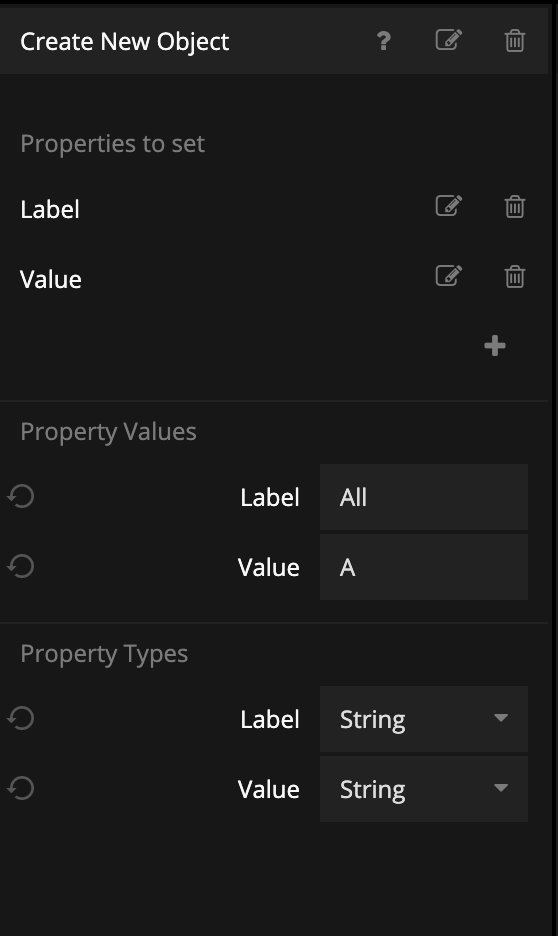
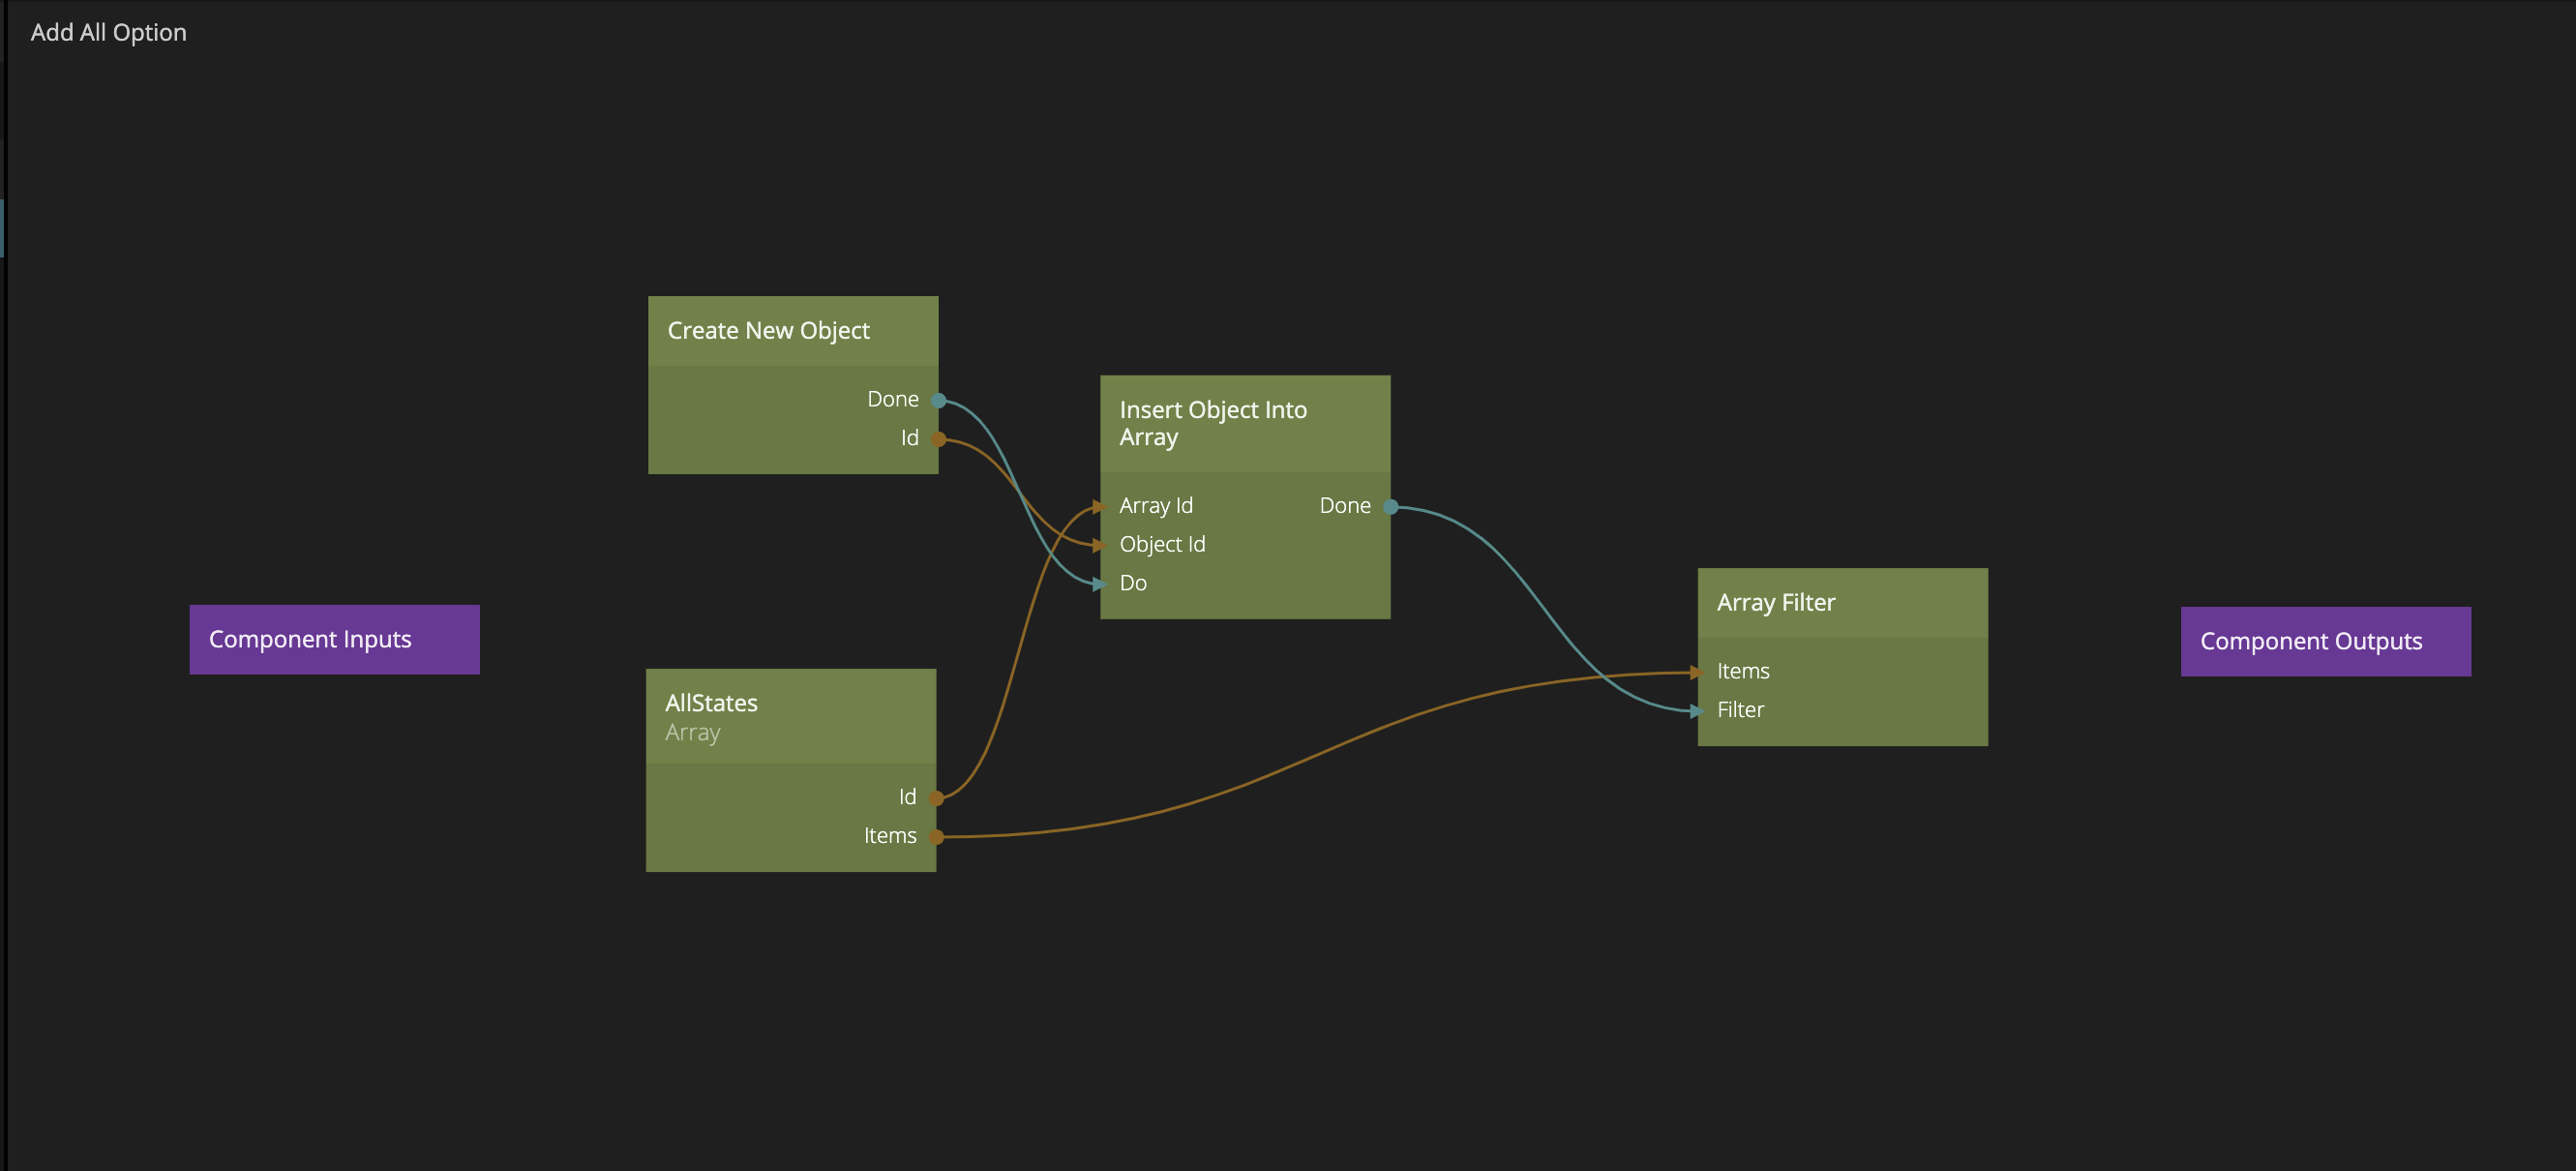
Next we want to use a Create New Object node to create a new object that we can then insert into the Array. Set up the Create New Object node like below and then we connect it like in the second image.
Now that we have a new Object, we want to insert it into our Array and we do that with an Insert Object Into Array node. Connect everything like below:
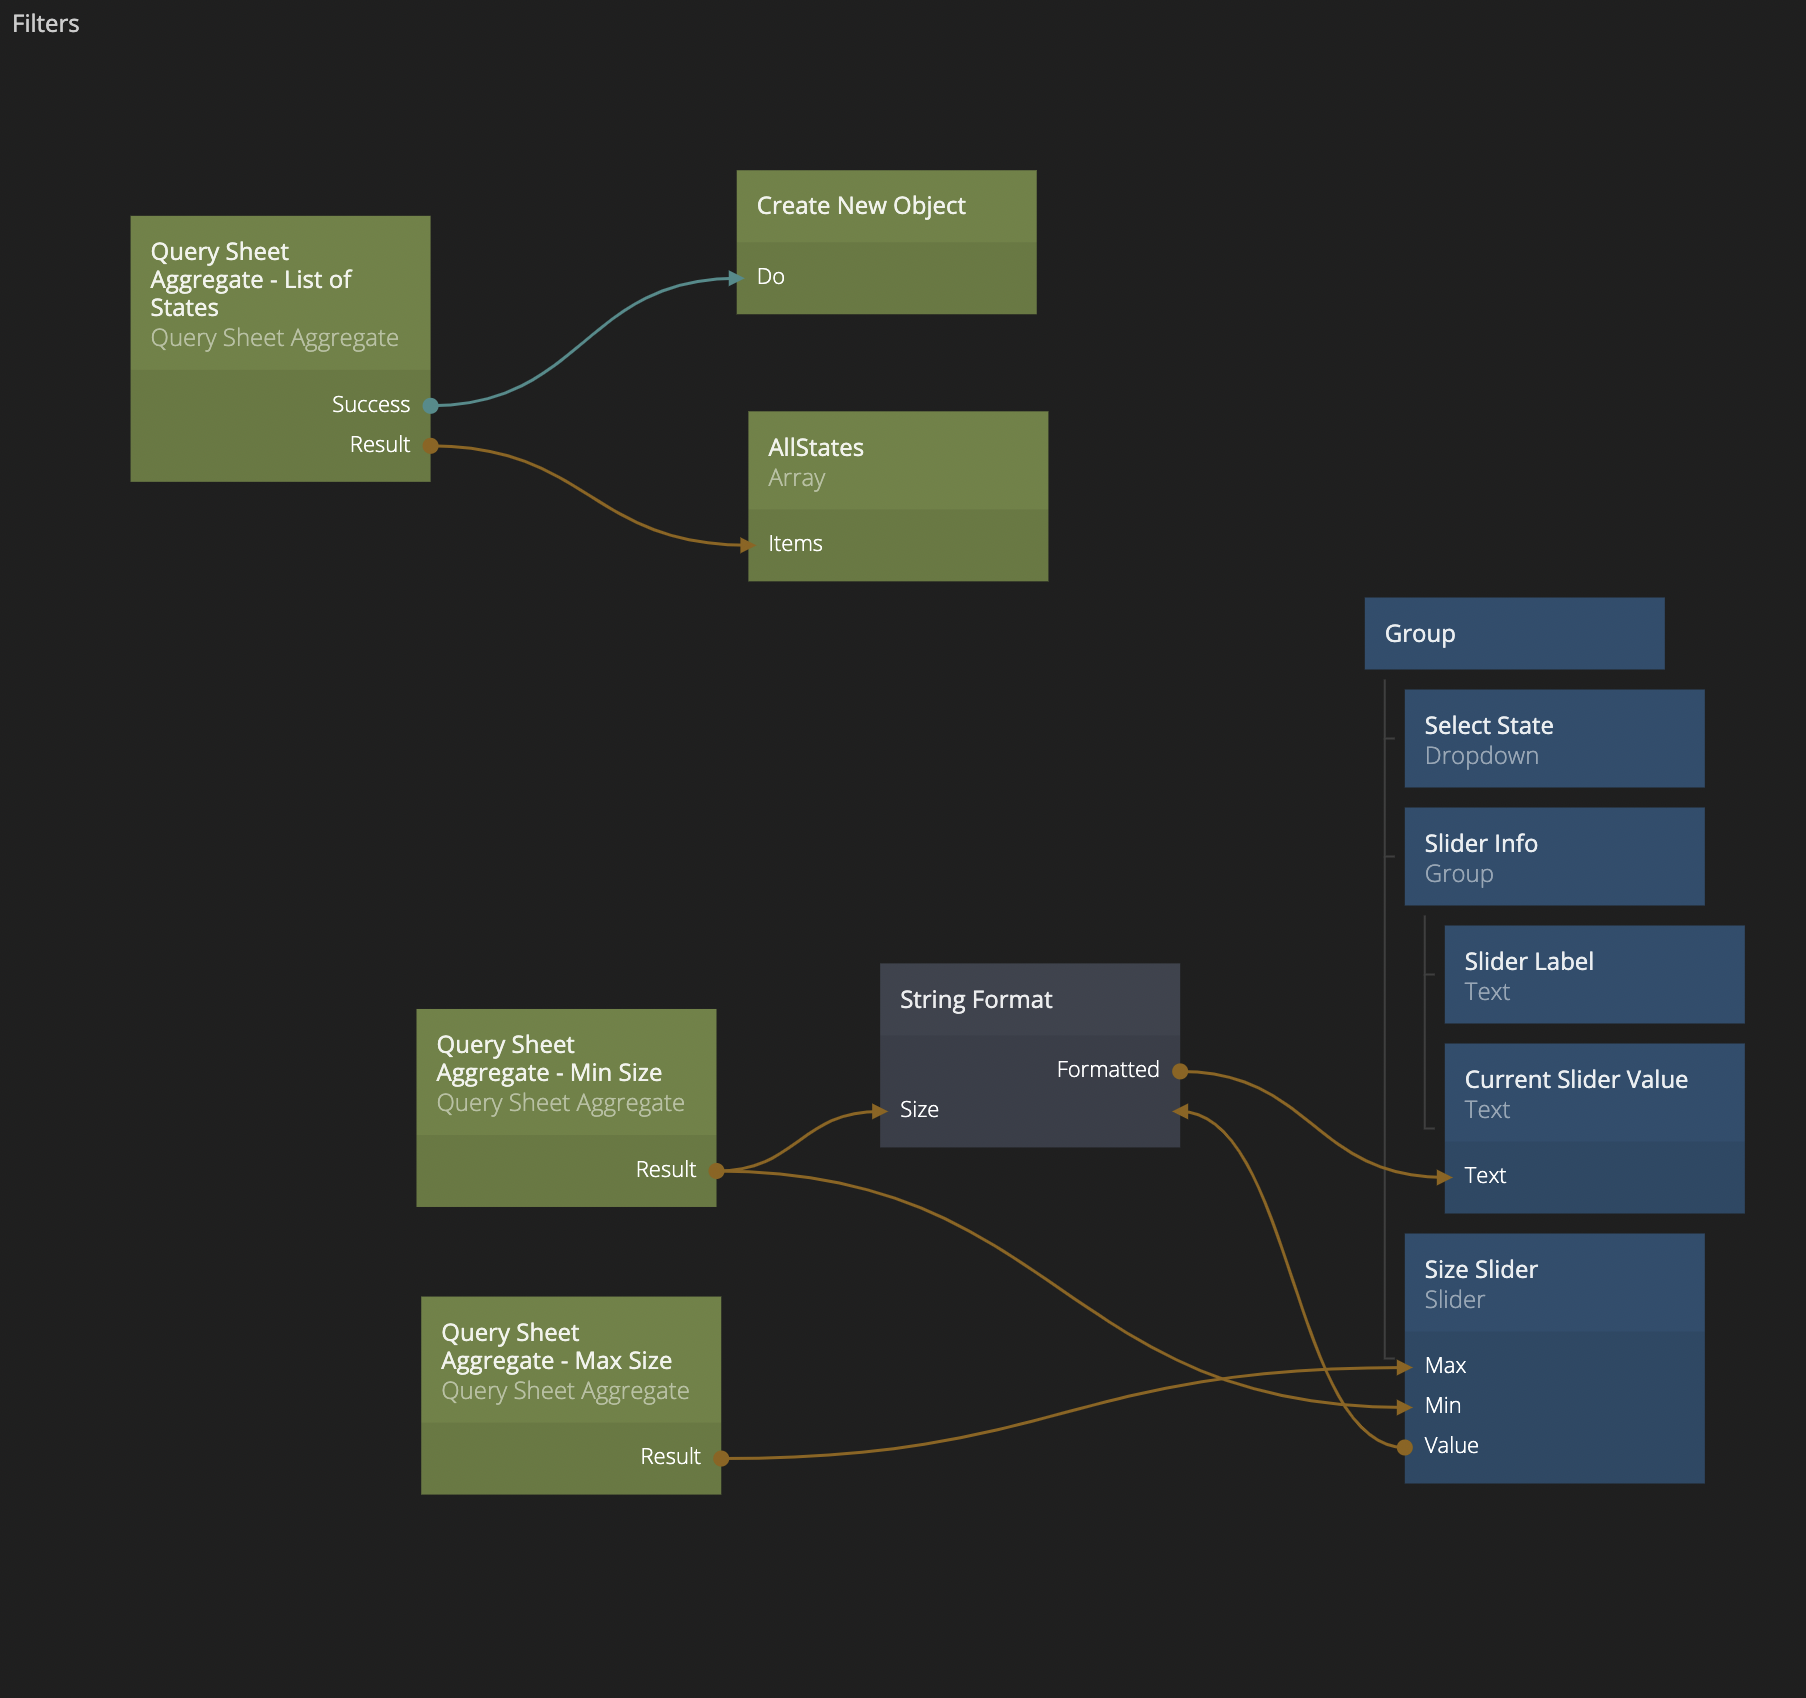
Our AllStates Array contains one extra option, the All option. Before we connect it to our Dropdown, let's make sure that the Array is sorted alphabetically, so we will connect an Array Filter node like in the image below. Here it's important that we use the Done signal from the Insert Object Into Array node, to tell the Array Filter to do the sorting, as that ensures that the All option is in the Array before we do the sorting.
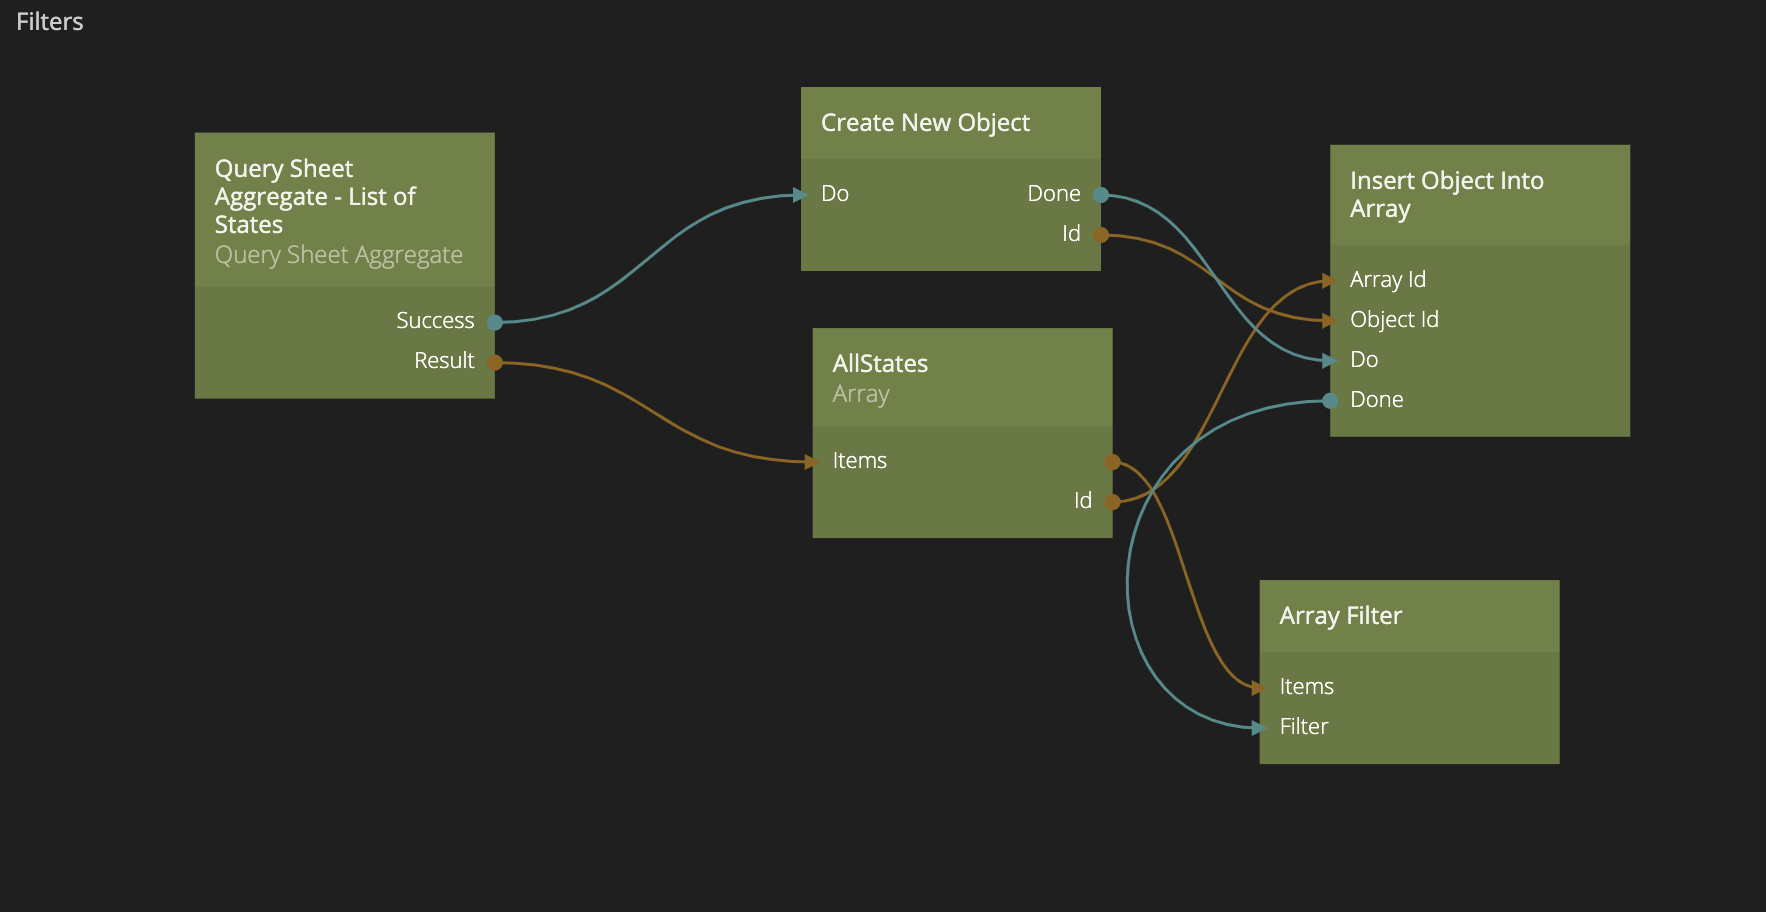
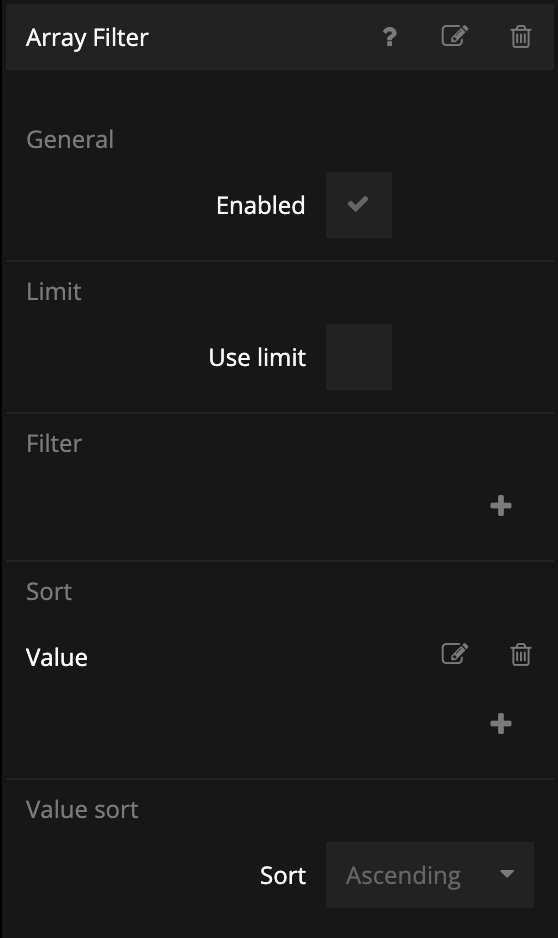
The Array Filter node should sort on the Value property of the items in the array, and we can do that by setting it up like this:
We could now make a connection from the Array Filter to the Dropdown, but as you can see the Filters component is getting quite big in terms of nodes.
Let's turn the selected nodes below into it's own Logic Component.

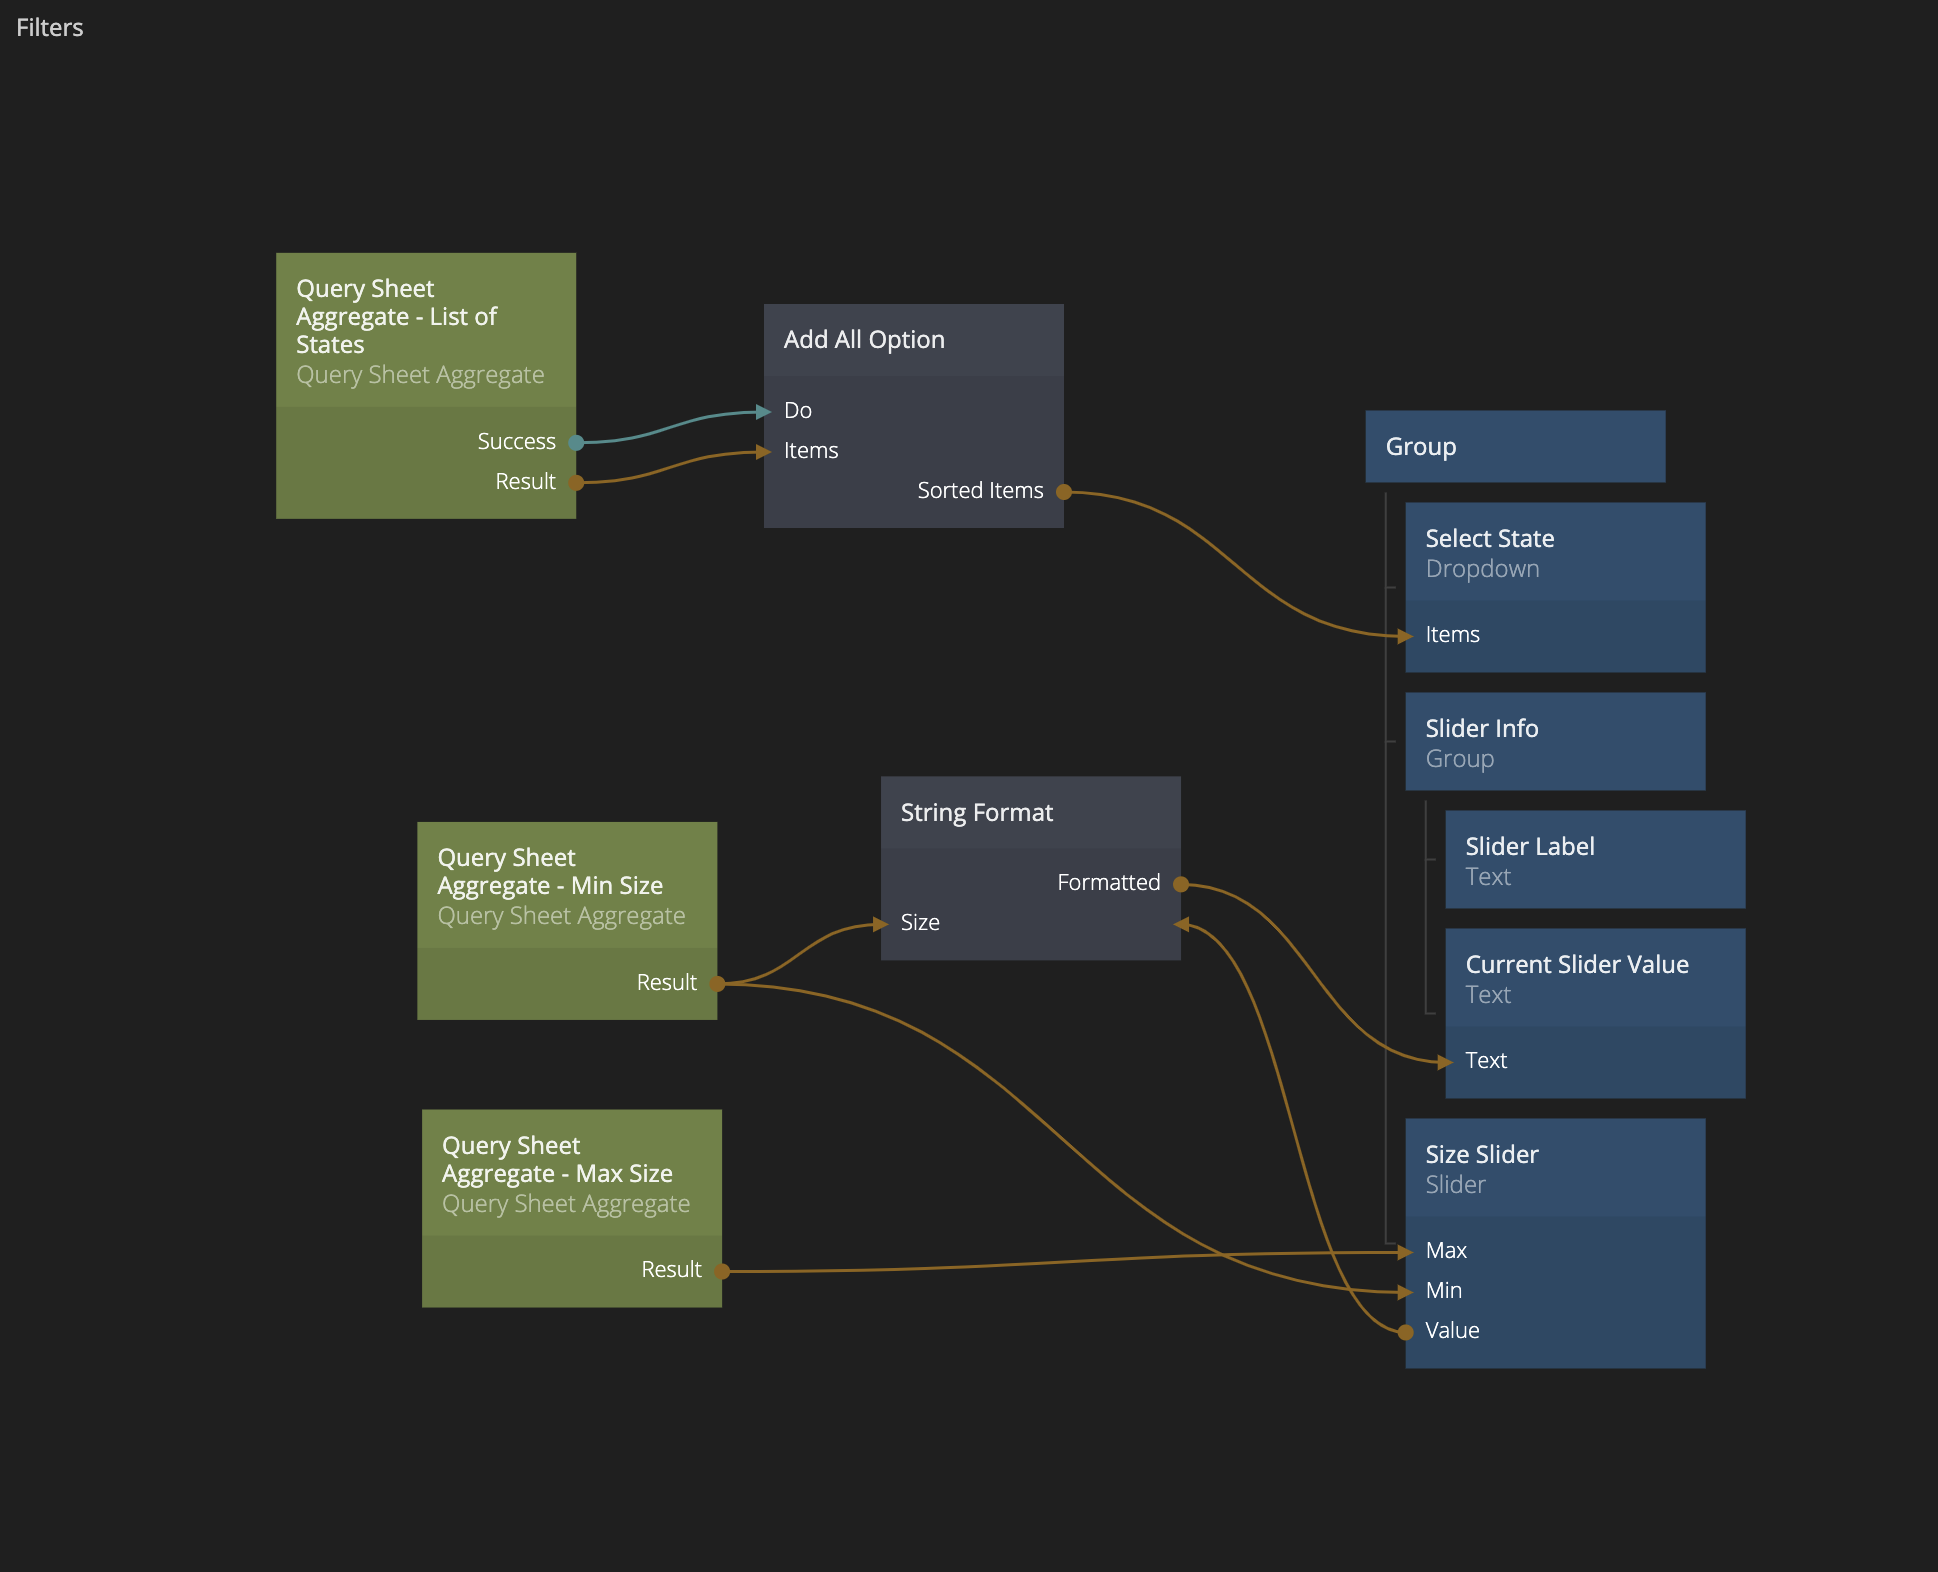
Creating Add All Option component
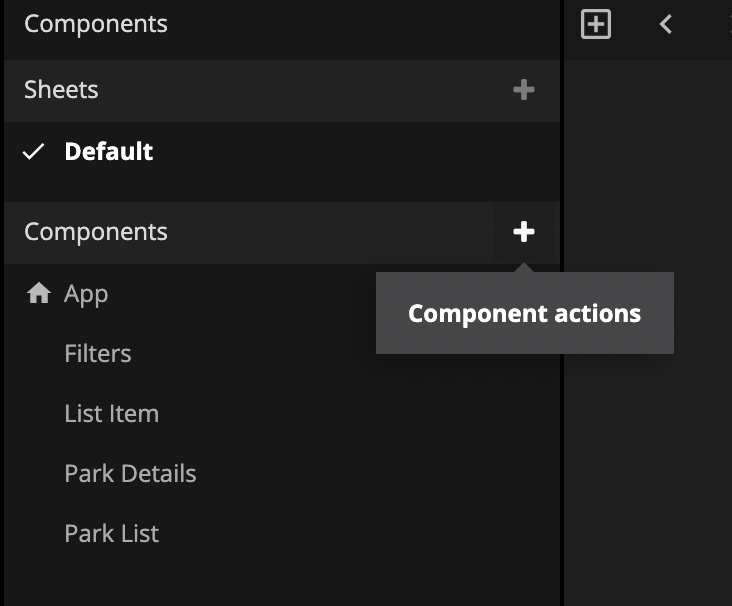
From the Component Actions button, select Logic Component and name it Add All Option.
Then from the Filters node, cut out the marked nodes and paste them into the Add All Option component (use standard keyboard shortcuts for cutting and pasting). It should now look like below.
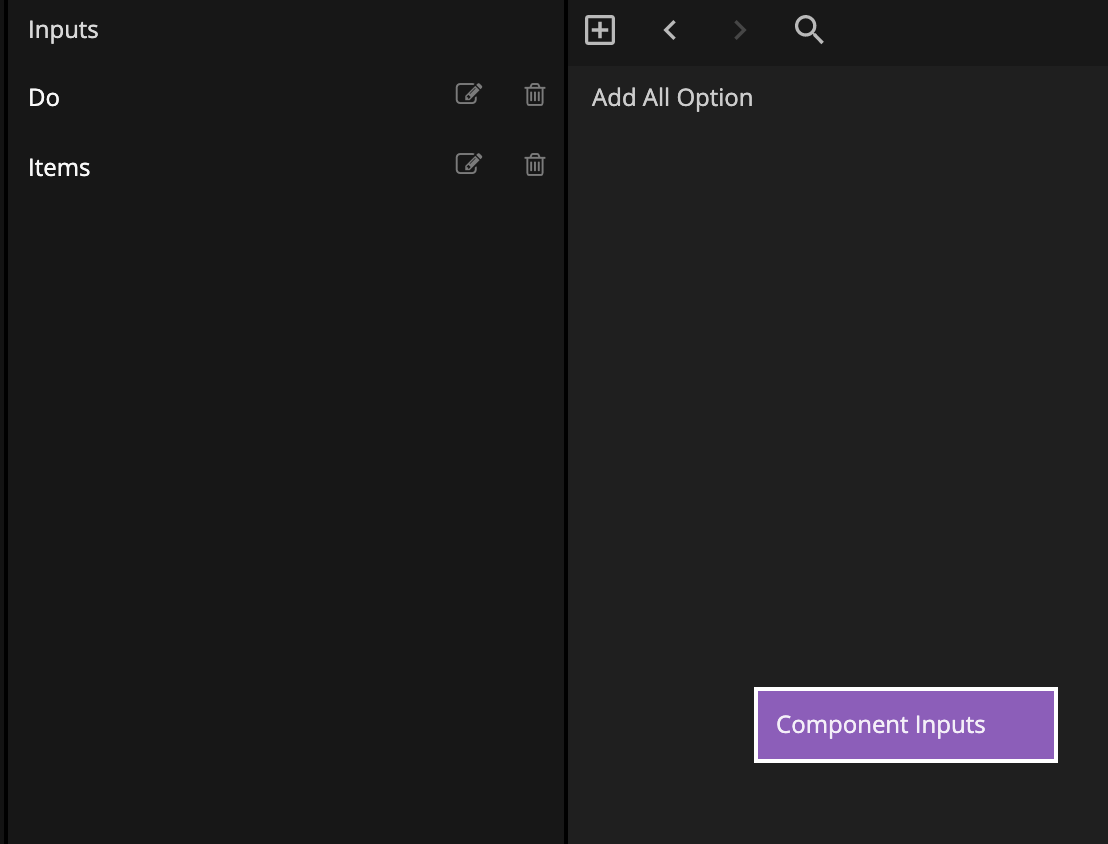
Let's add a port to the Component Inputs node that we call Items:
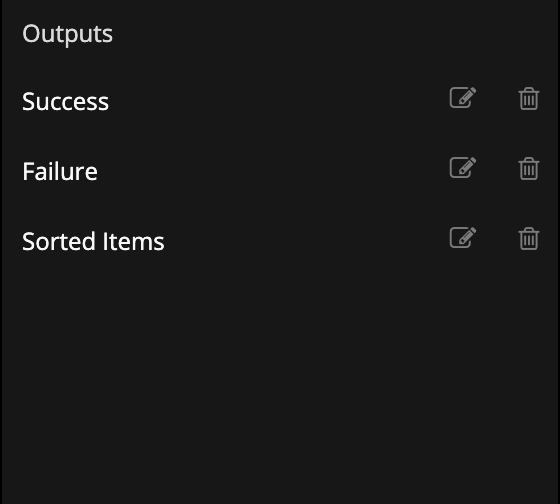
We also want to send out the sorted array, so let's add a port on the Component Outputs node called Sorted Items.
Now we just make the following connections.
Back in the Filters component let's add out newly create Add All Options node, and hook it up like this:
Now we have a nice Dropdown with our All option as well.
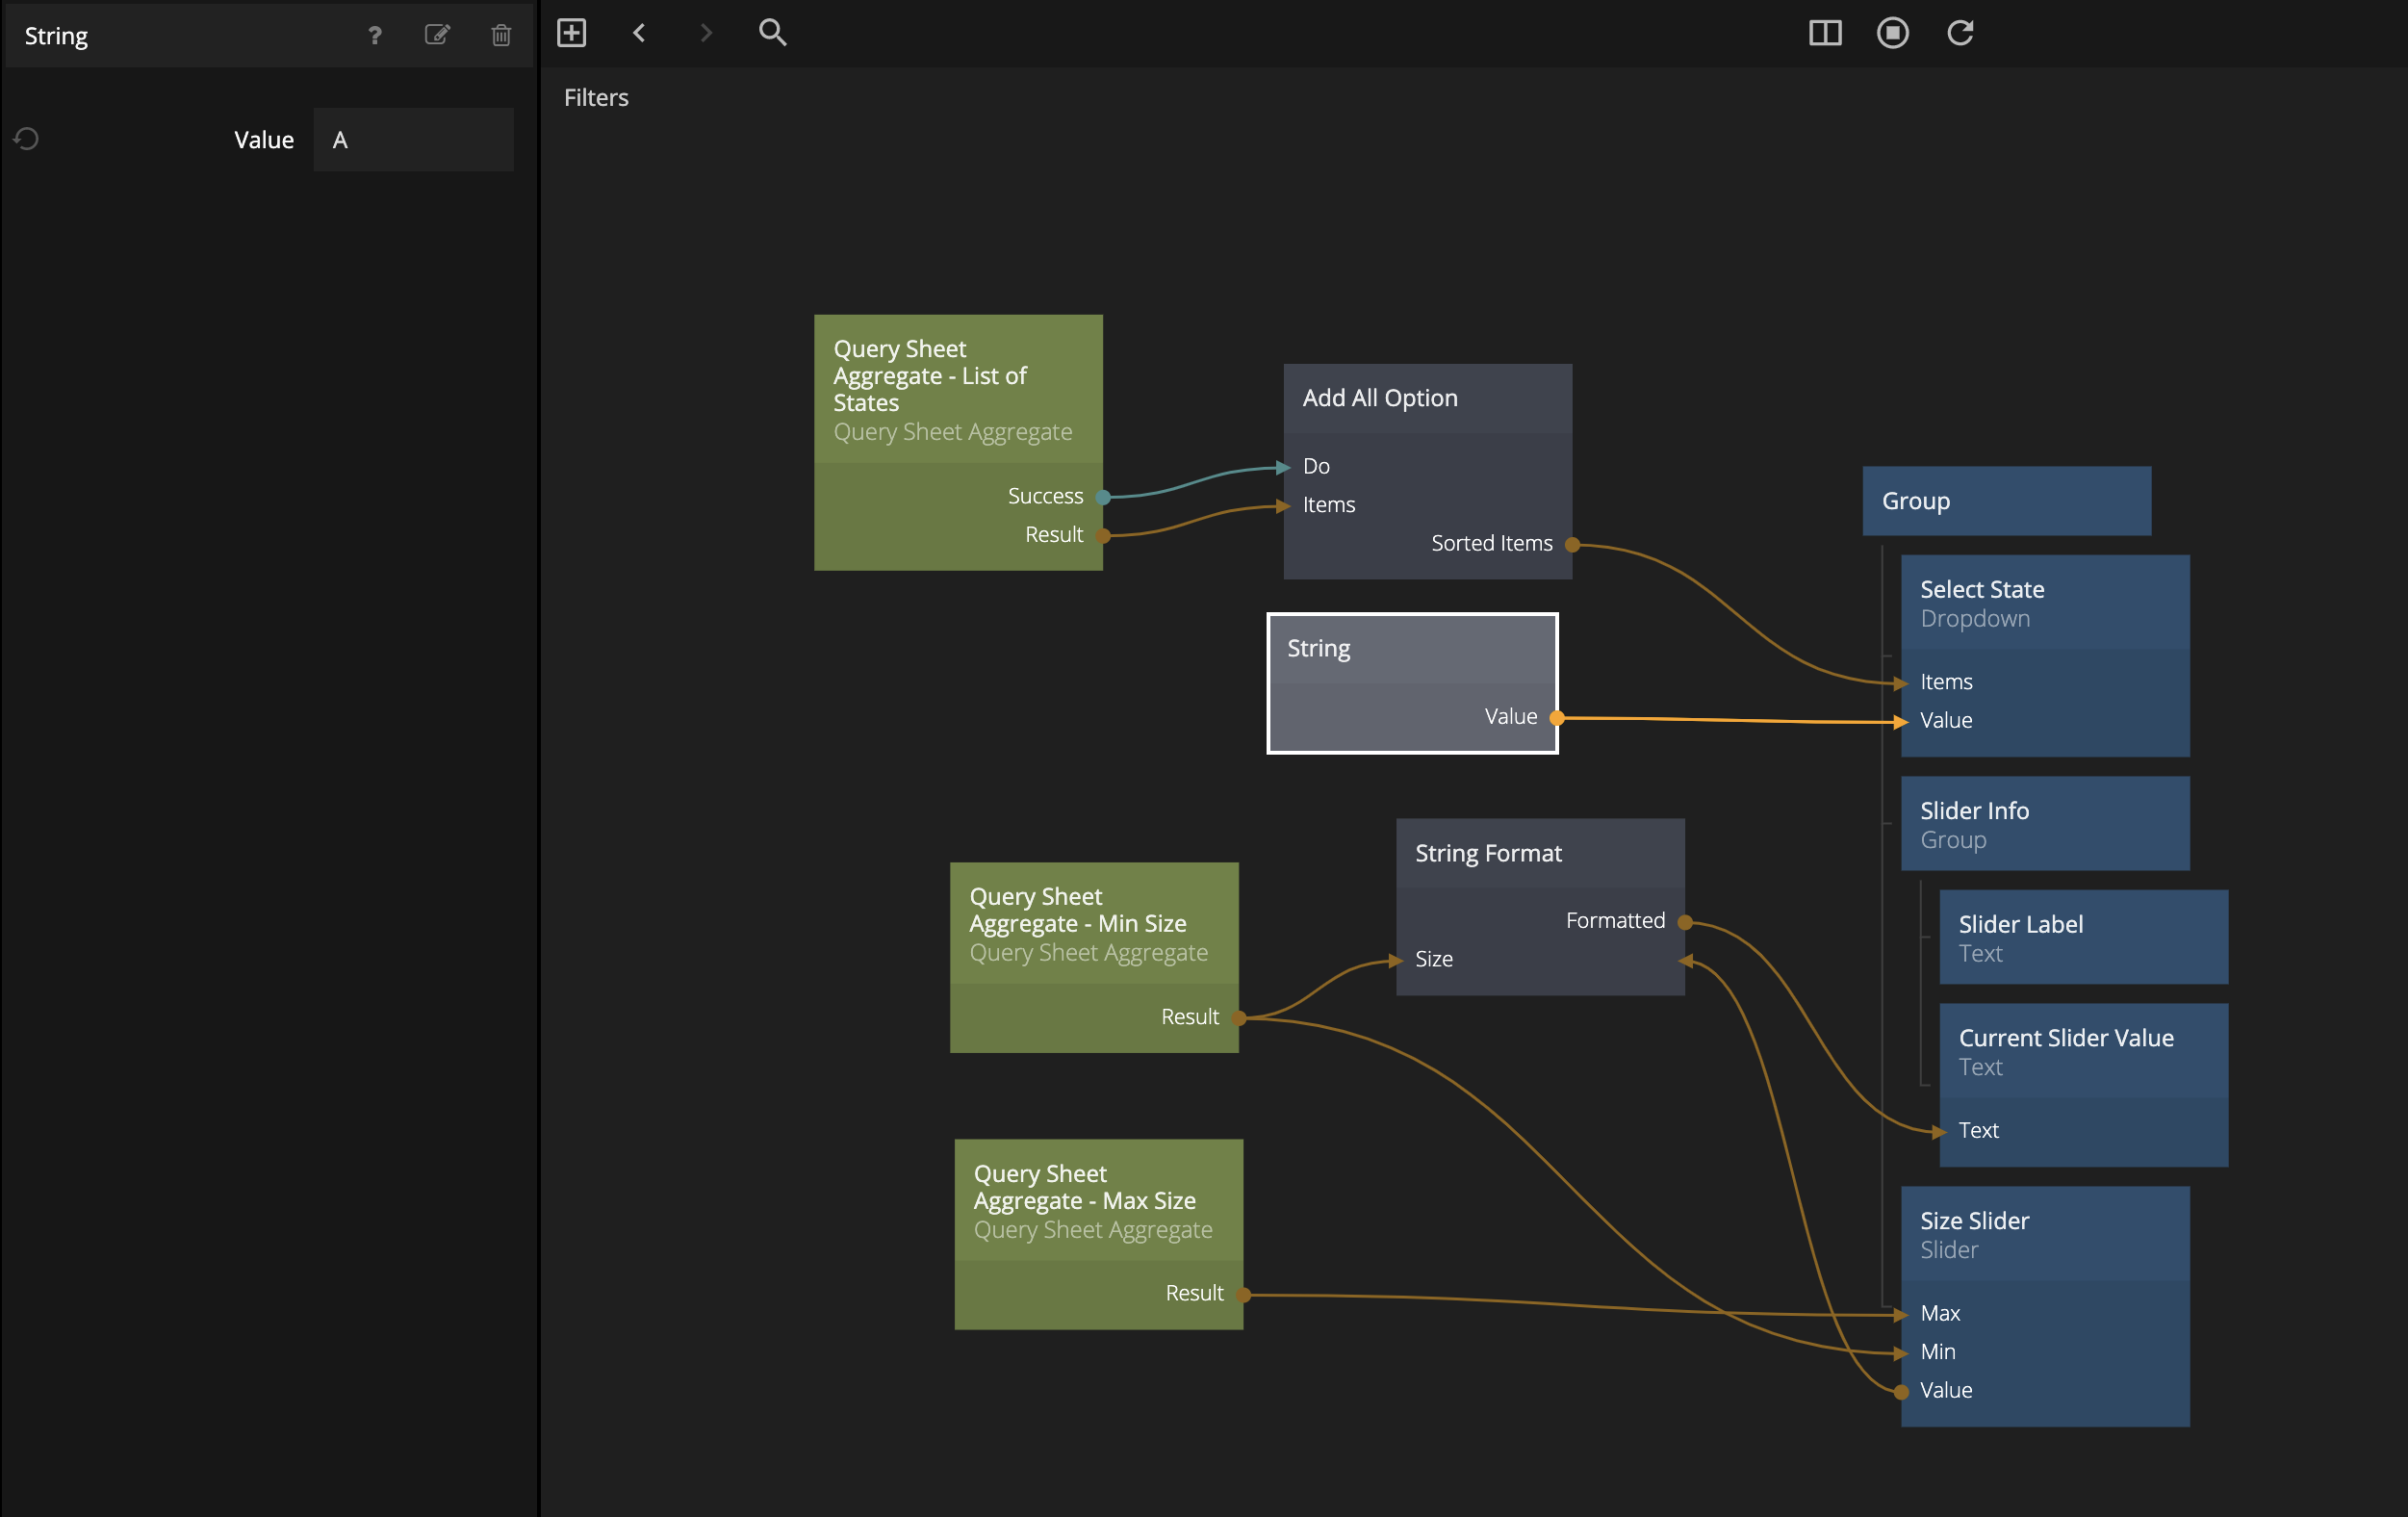
We can easily fix that but adding a String node and giving it the value "A" and then connecting it like the image below:
Adding filters.
All of our visuals are now set up. All that is missing are the actual filters. Let's work on those now.
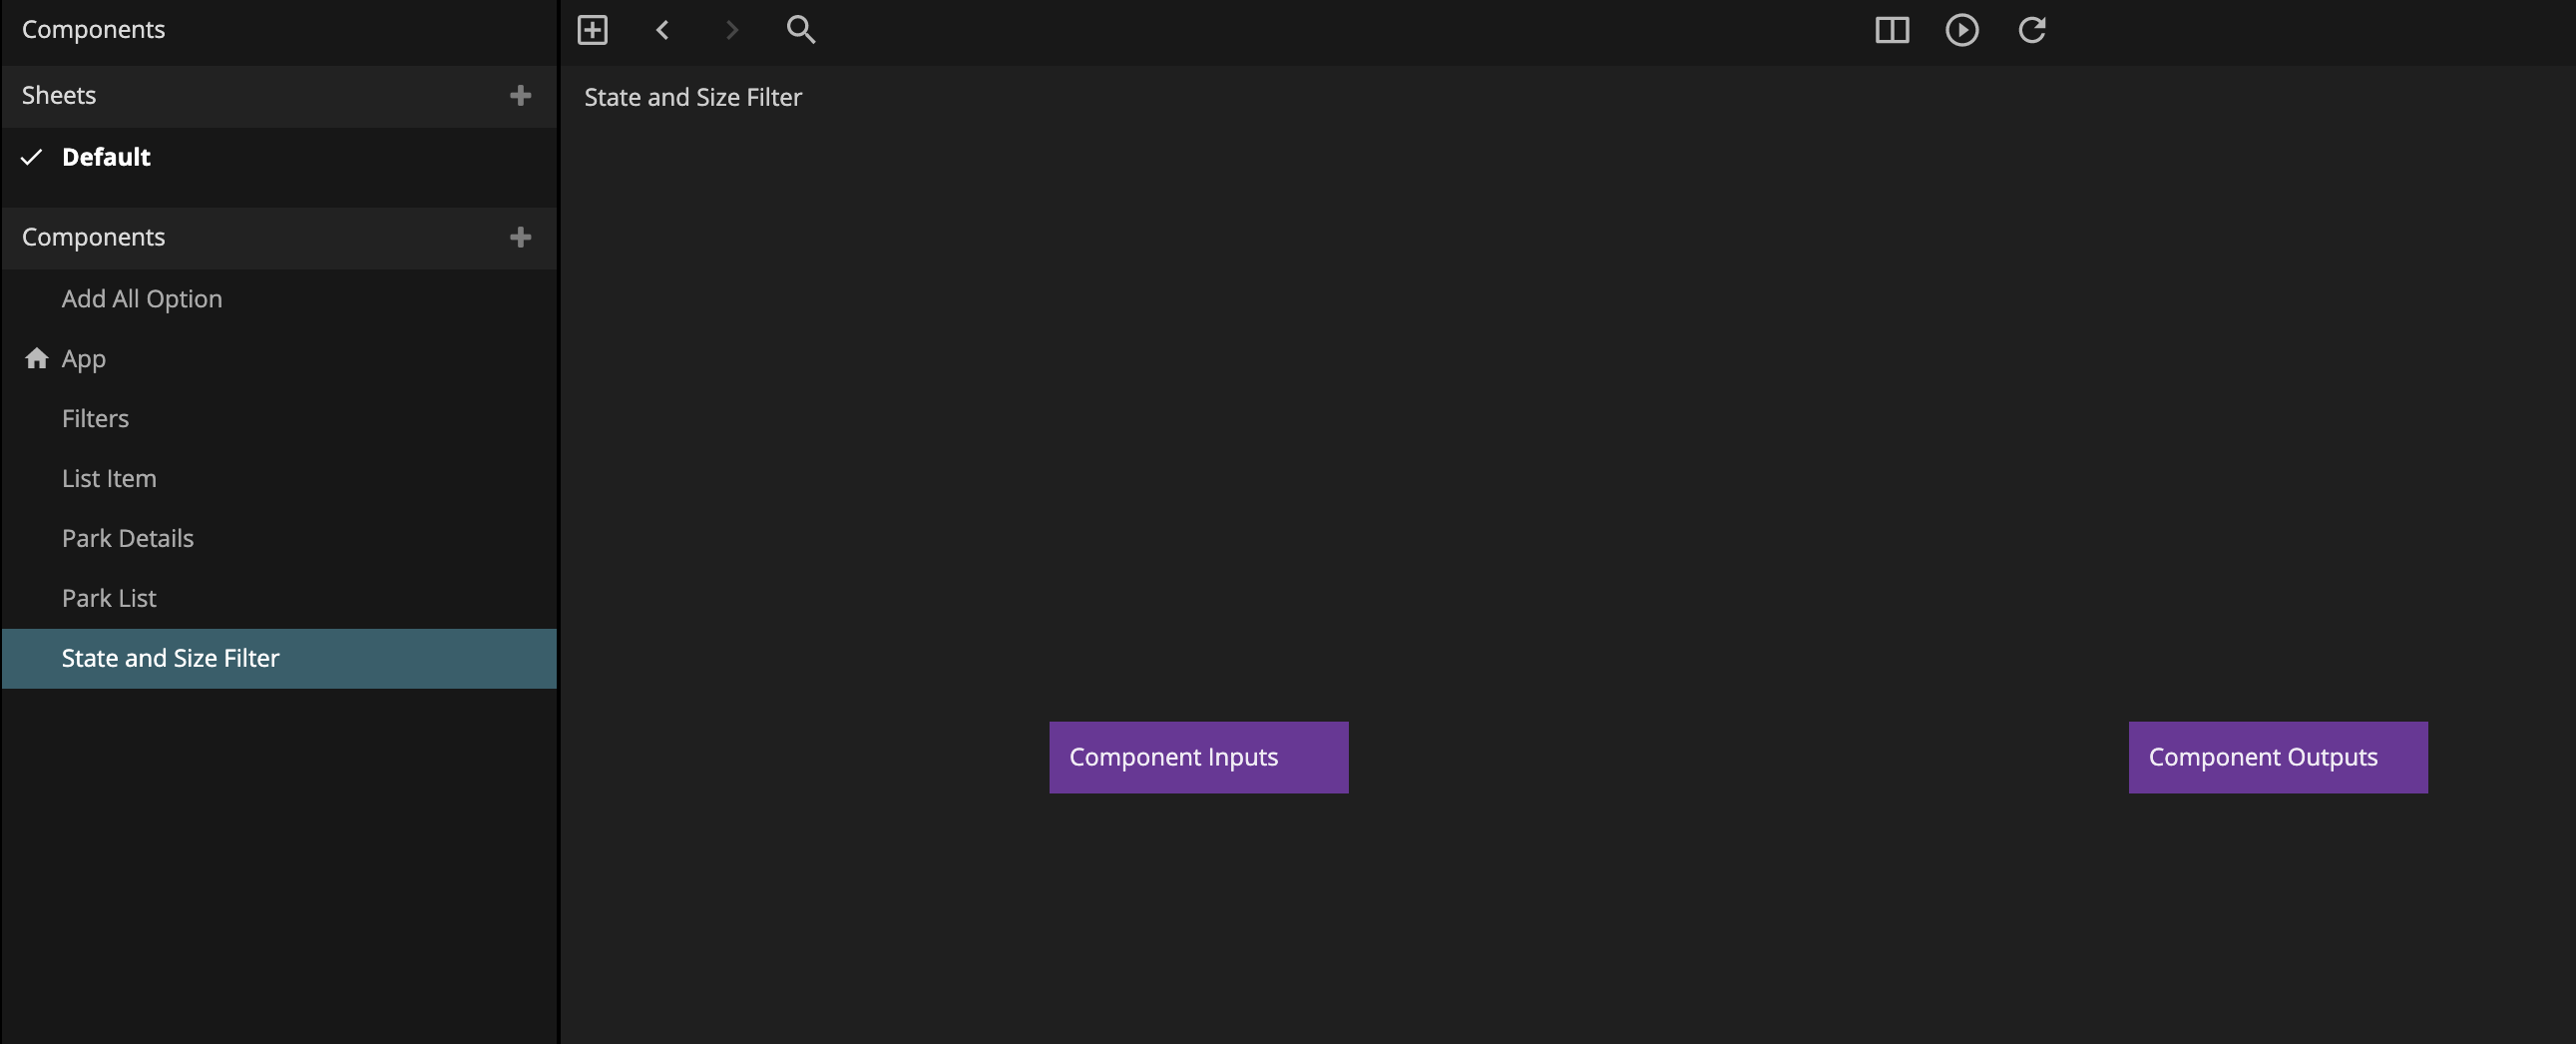
First let's add a new Logic Component that we call State and Size Filter.
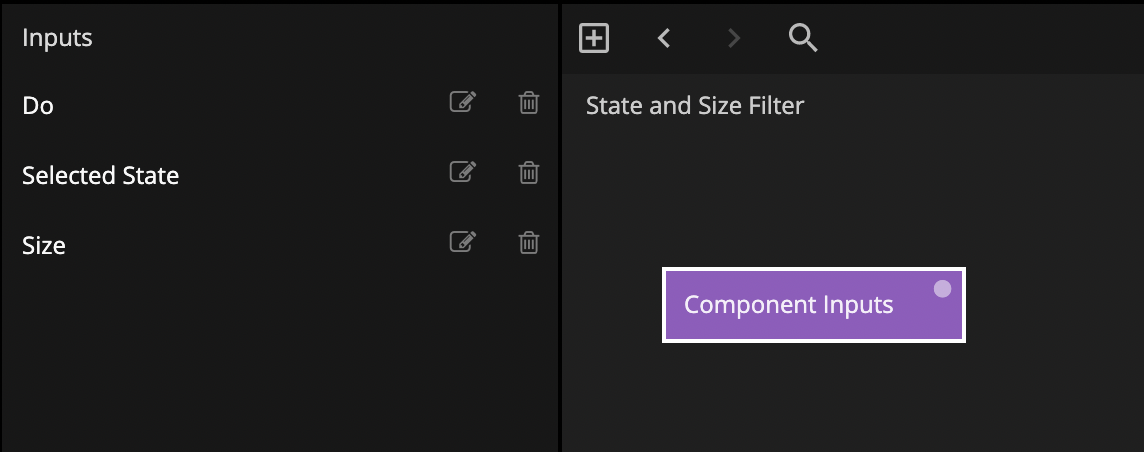
Add two ports to the Component Inputs node called Selected State and Size. You can also delete the Component Outputs node, we won't need that.
Jump back to the Filters component and add the State and Size Filter component and hook it up like this:
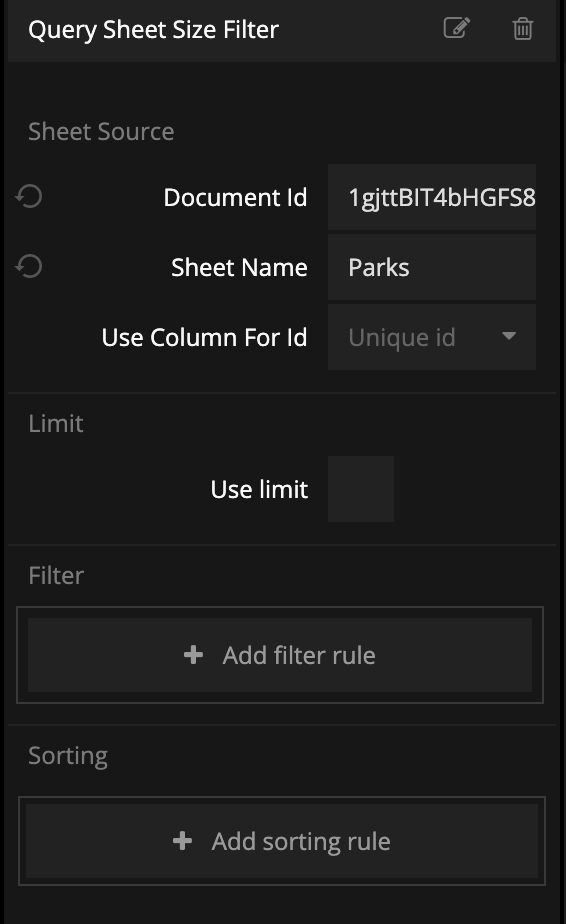
Now, we head back to the State and Size Filter component. Let's first make a filter for Size. We will add a Query Sheet node, and set it up like this.
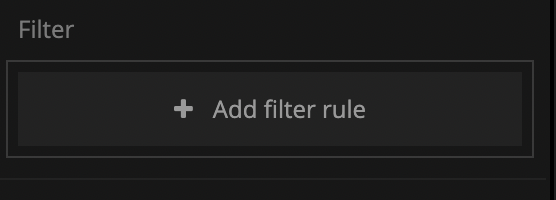
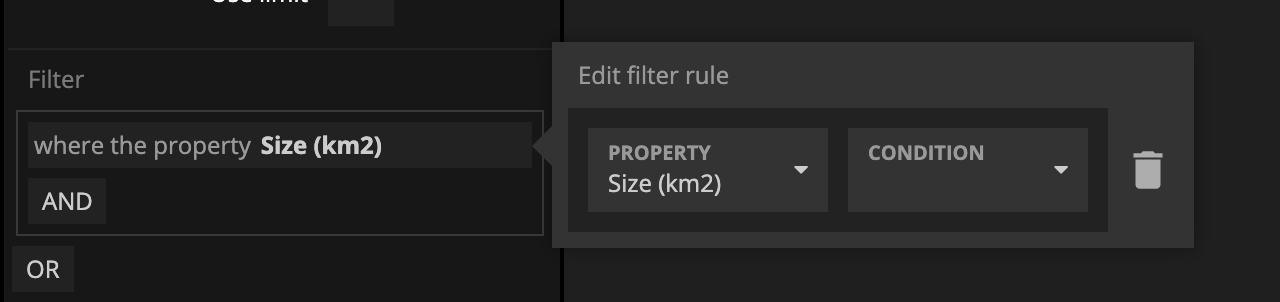
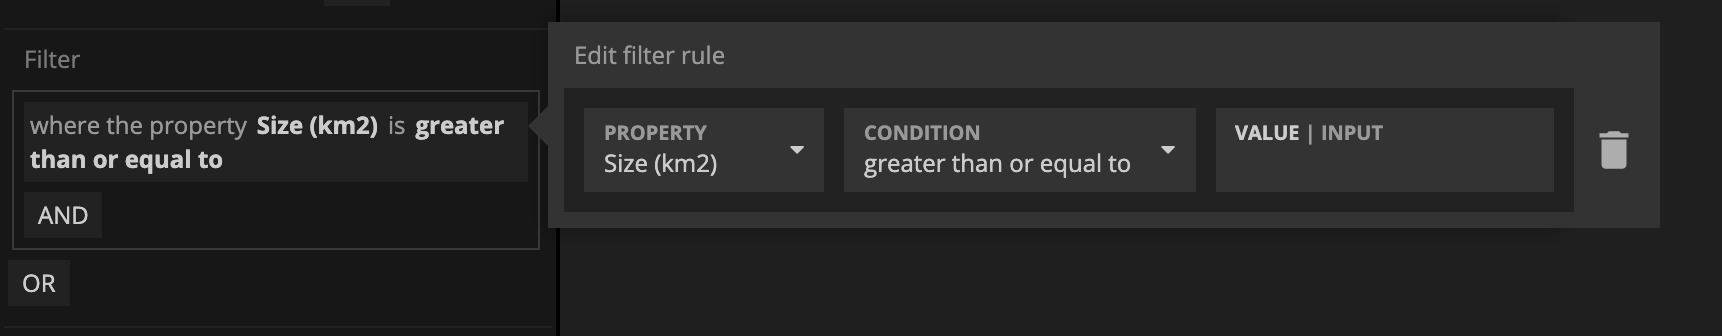
The Query Sheet node has a very nice visual filter builder so click here to add a filter:
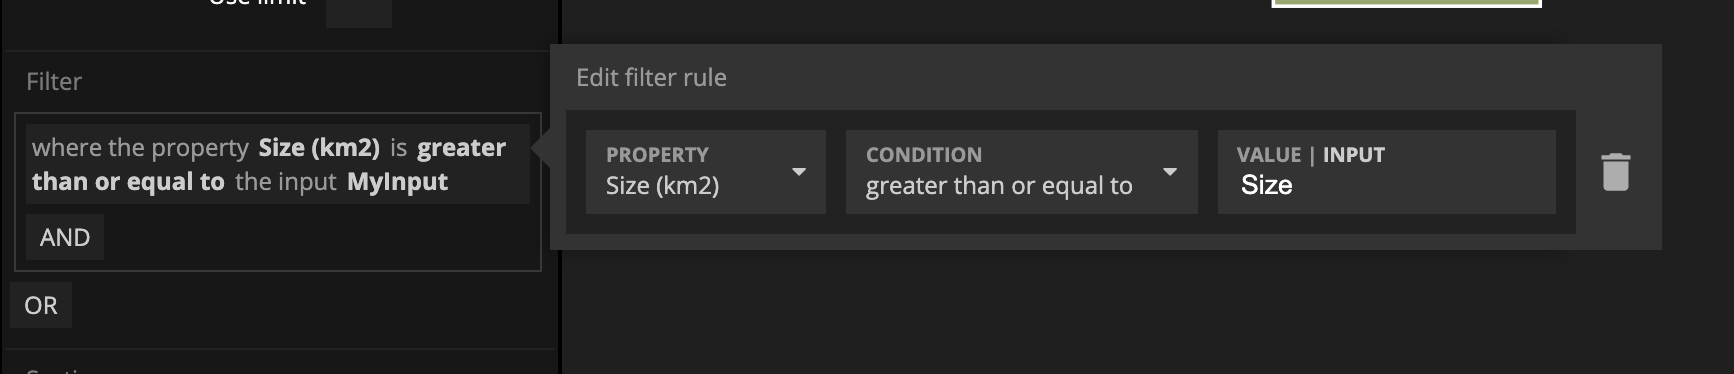
Then let's build out our filter using the visual builder. The following images show you each step. T
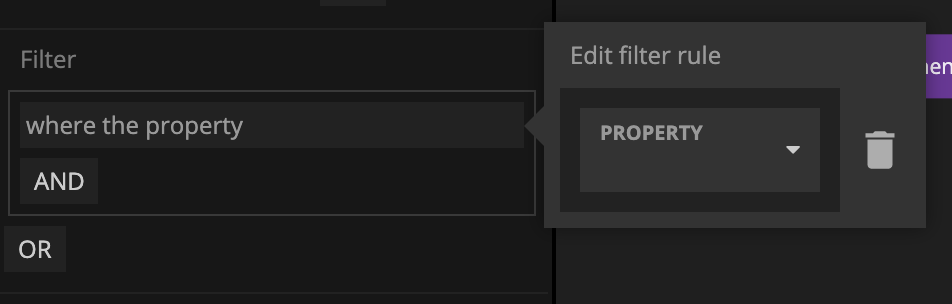
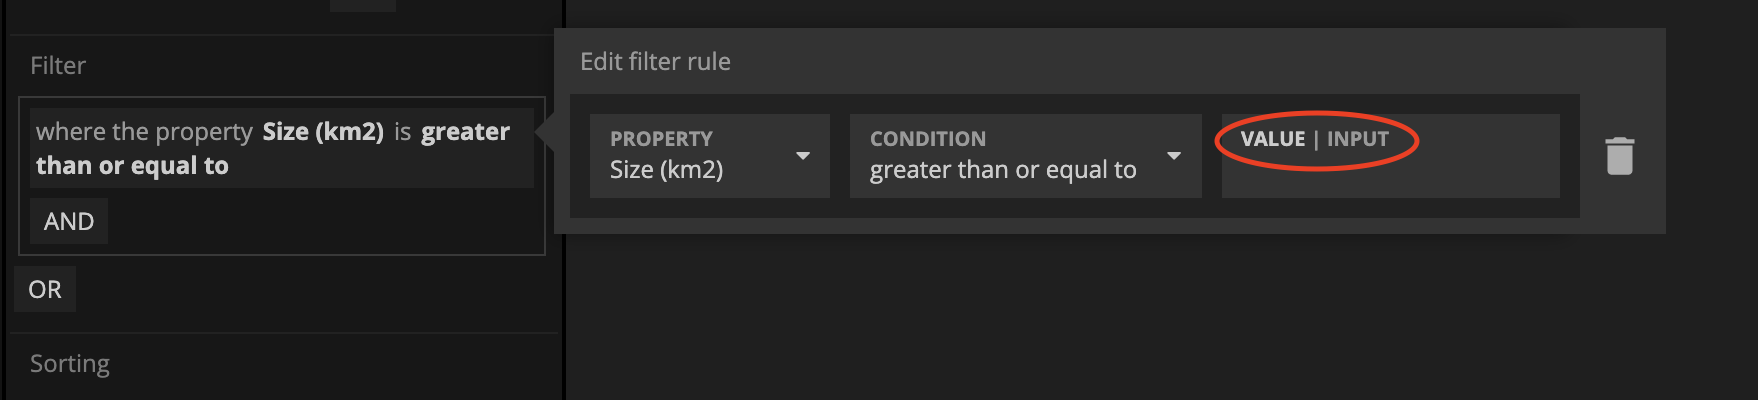
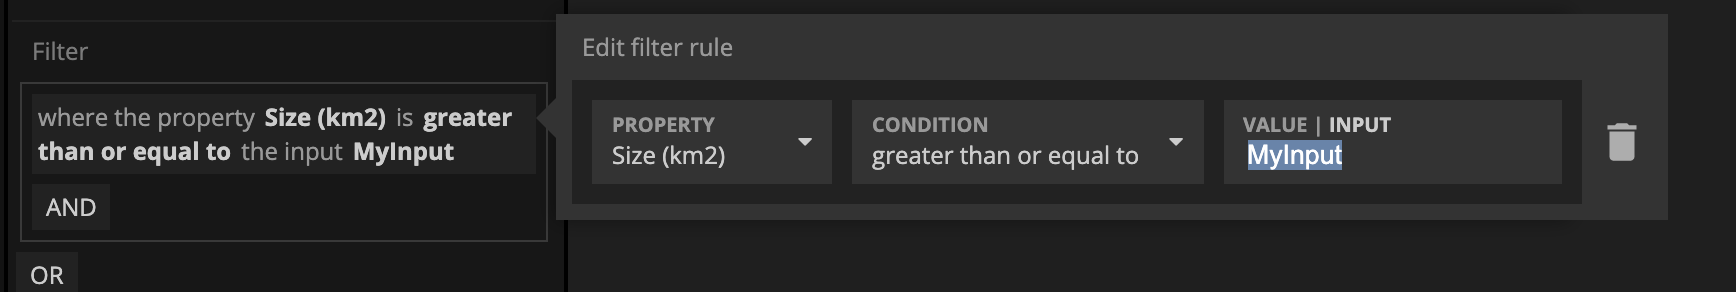
In this final step it's important to change the Value to Input, and then you can change the MyInput to a better name, like Size for instance.
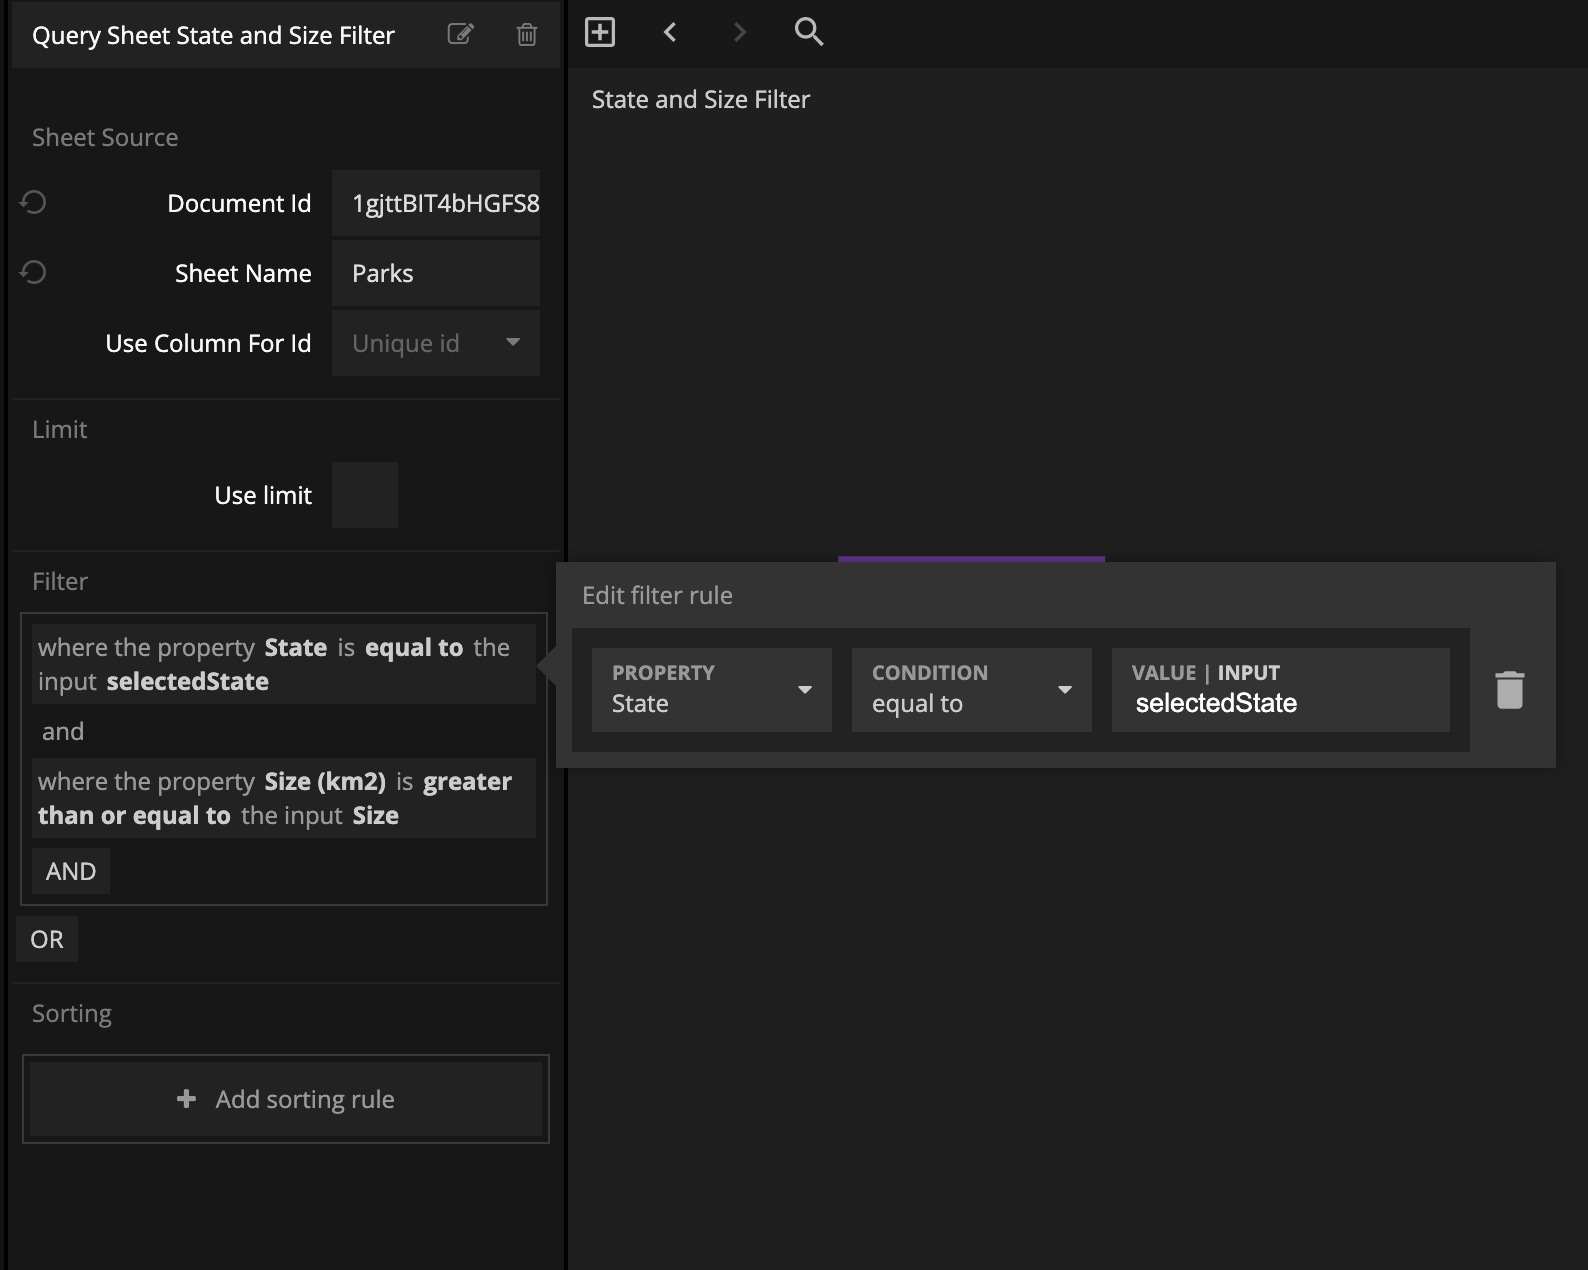
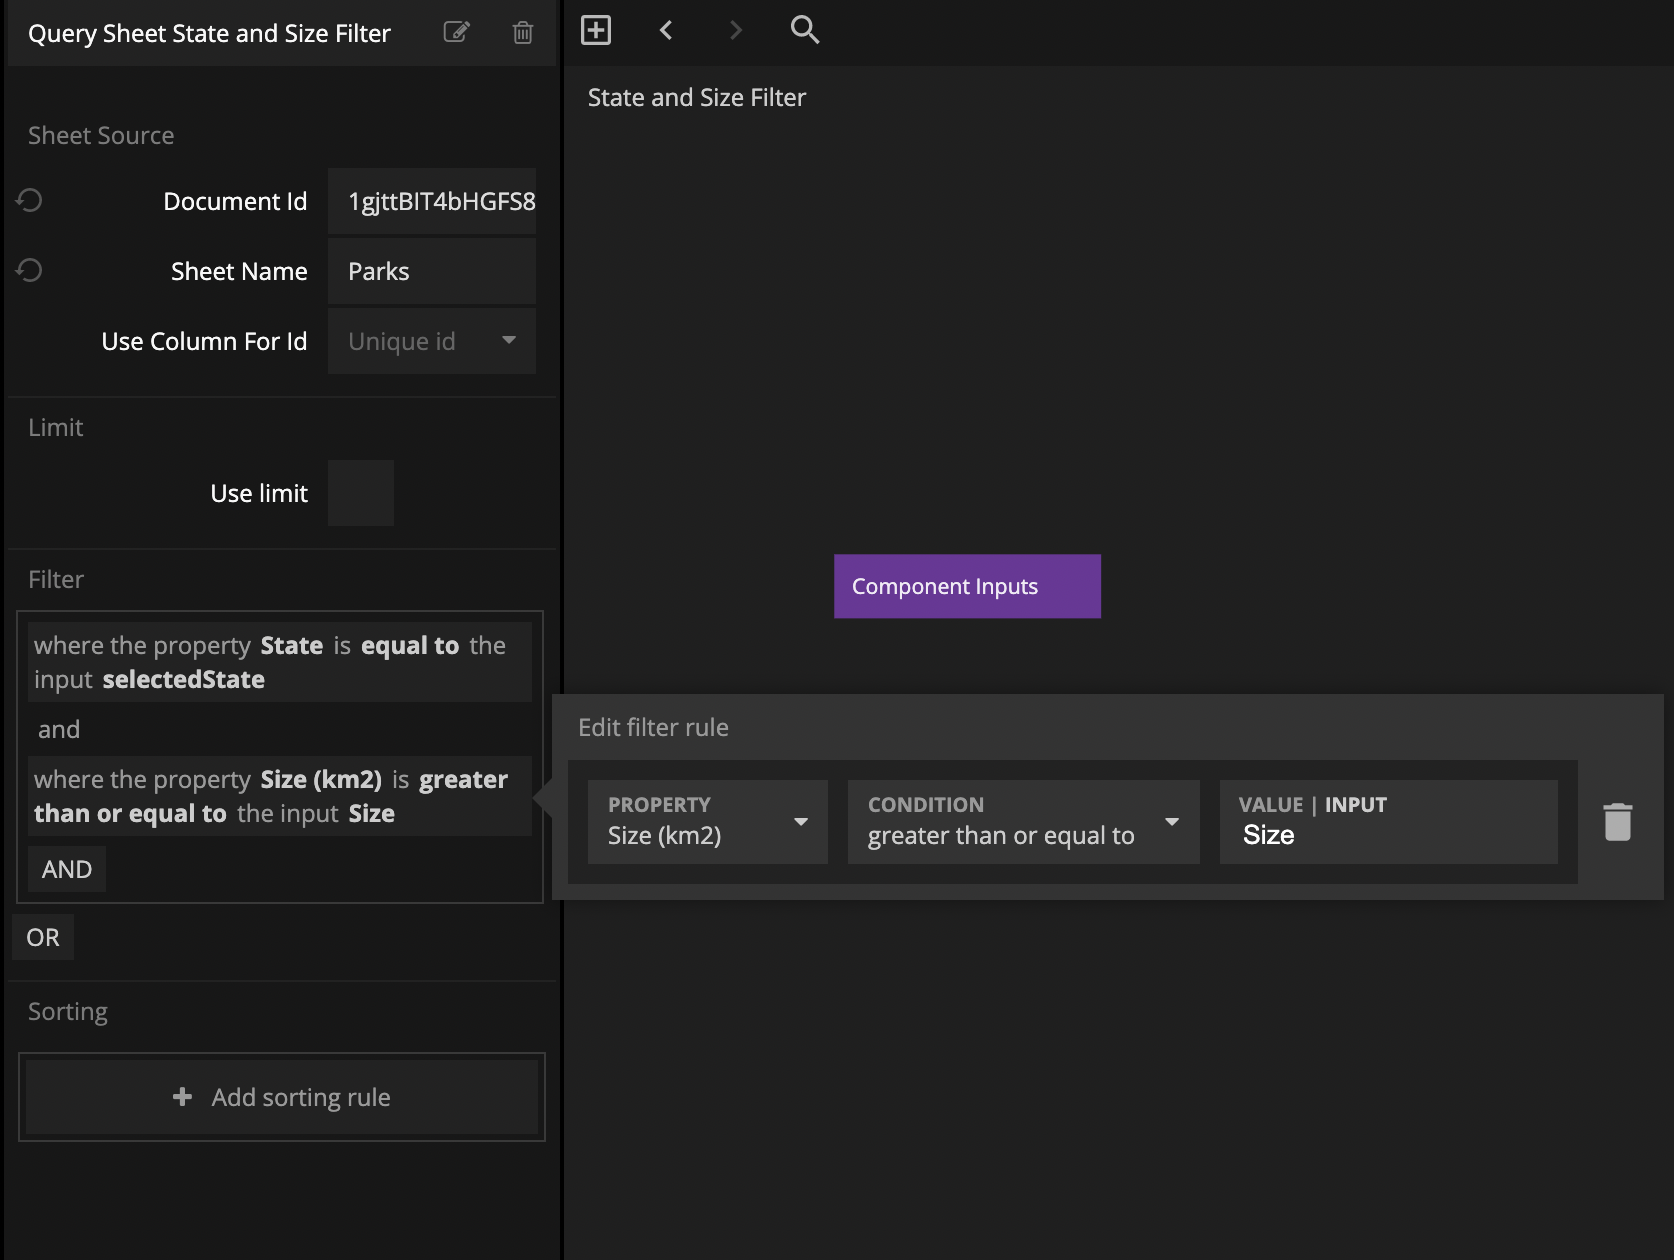
We are going to add one more Query Sheet node, and this one we will call Query Sheet State and Size Filter. Then add two filters to it so the final properties for it looks like this:
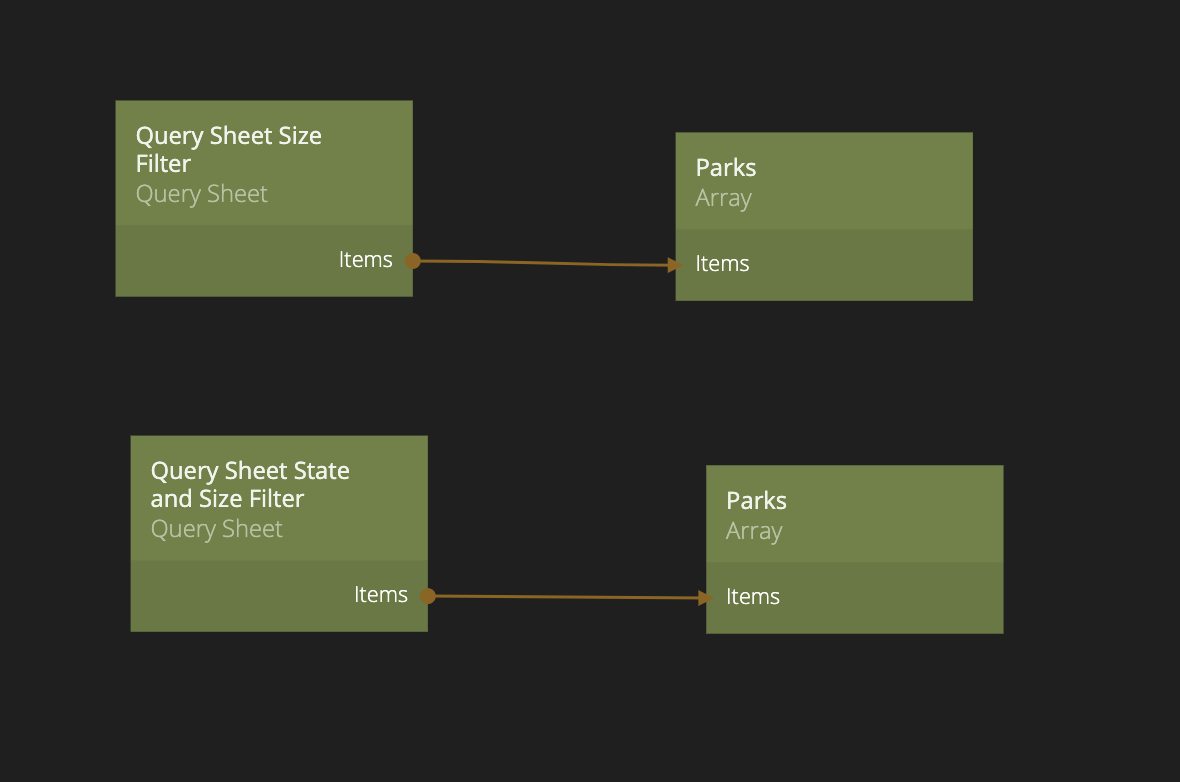
Next, we want to take the output from our Query Sheet nodes and hook them up to the Array node with the id Parks. If you remember from the previous guides, we are using this Array to feed the Repeater node that creates our list. If the Array is updated or changed, the Repeater node will automatically rerender, so everytime we get a new result from our filter nodes the list will update.
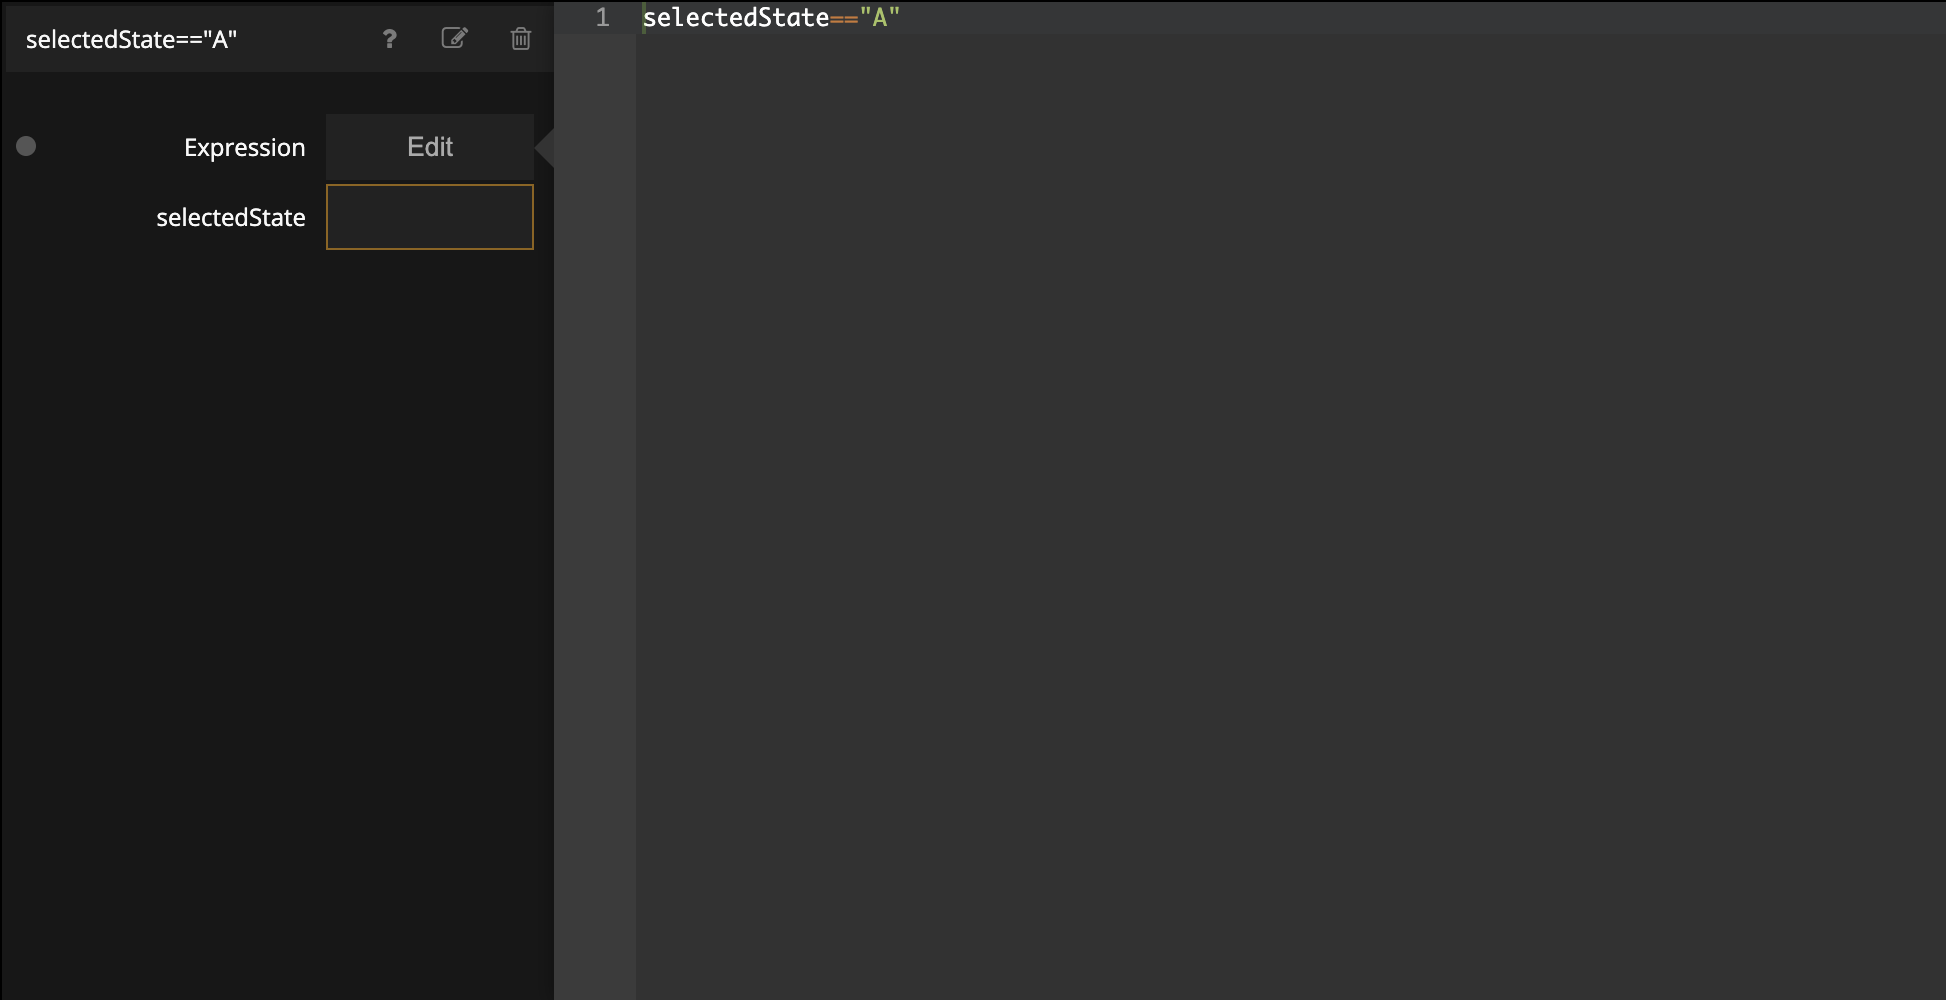
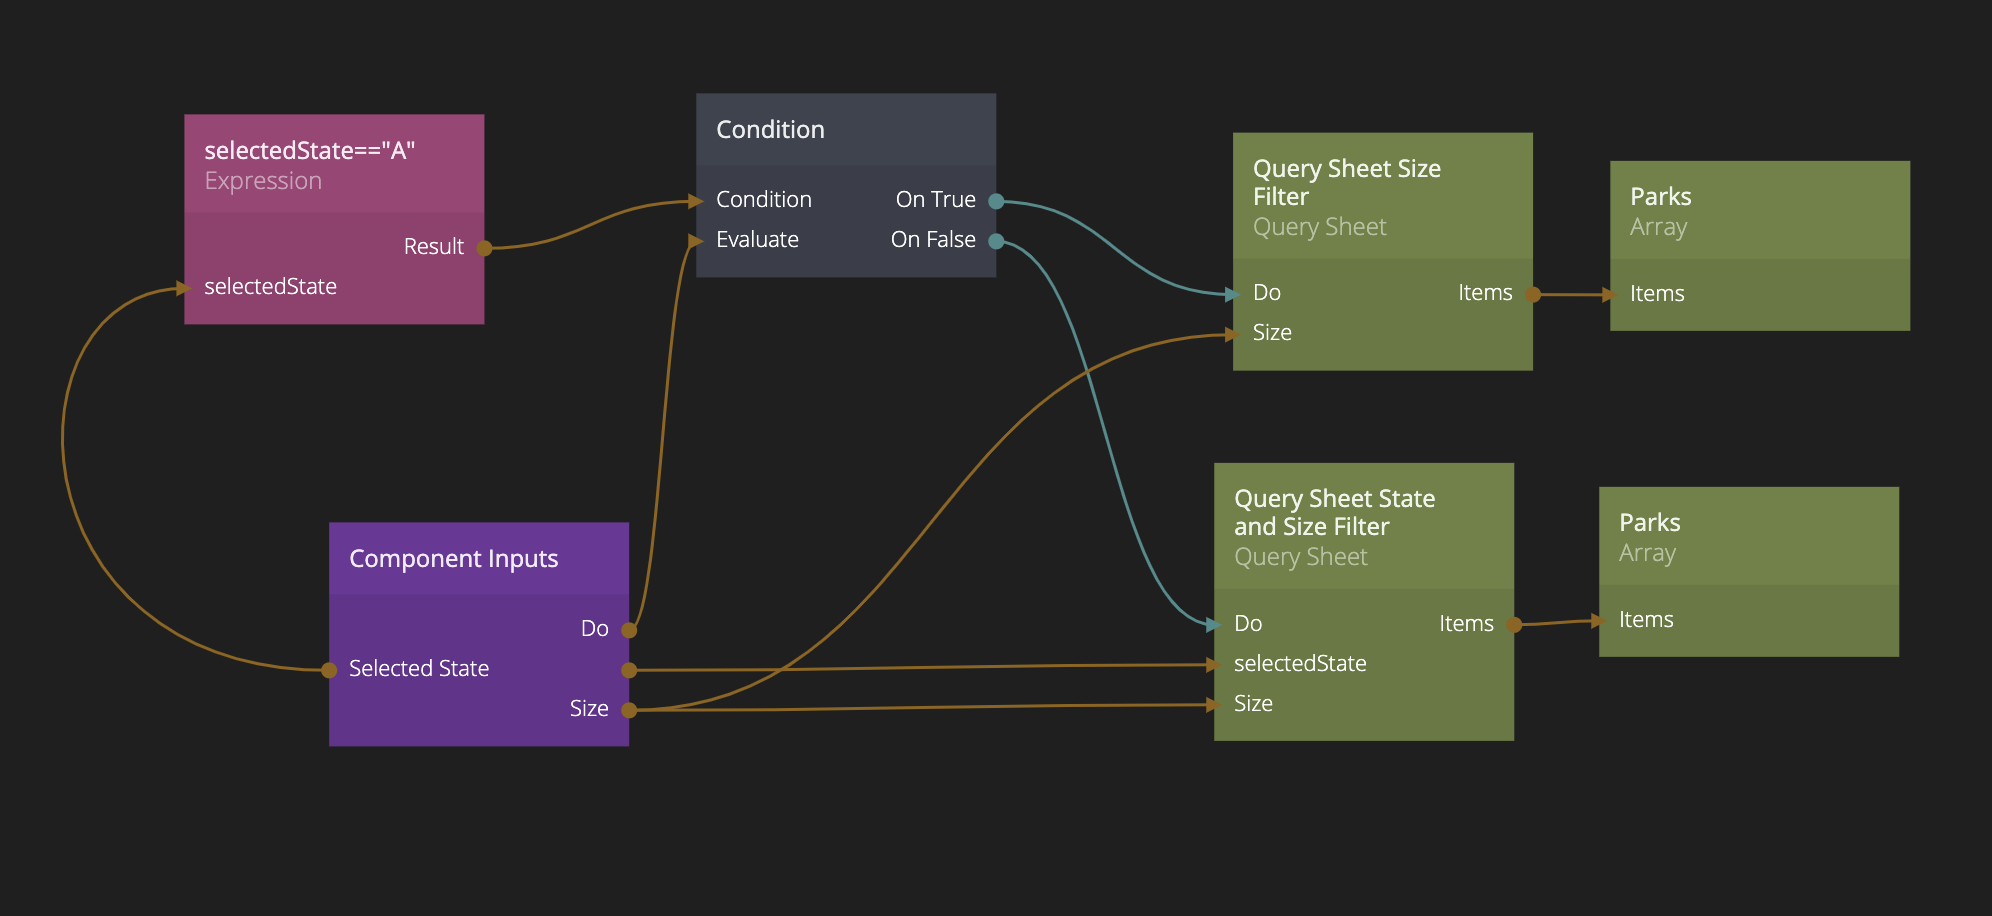
So why did we create two Query Sheet nodes with two different filters. It's so that we can handle the case when we choose All as the option in the Dropdown list. All is not a state that exists in our sheet, so the filter that is looking at both state and size will fail everytime we feed A into it. So to handle this we will use an expression in combination with a condition node to check if we are looking at all states, in which case we will just filter on size, or if we have selected a specific state, then we can filter on both state and size. The images below first show the expression in the Expression node, and the second image shows how everything should be connected.
Summary
In this guide we added filters to our National Parks and used the Query Sheets Aggregate nodes. Hope you enjoyed it, and you can import the final project by clicking the "Import" button below and follow the instructions.
