Outputs.Data = {
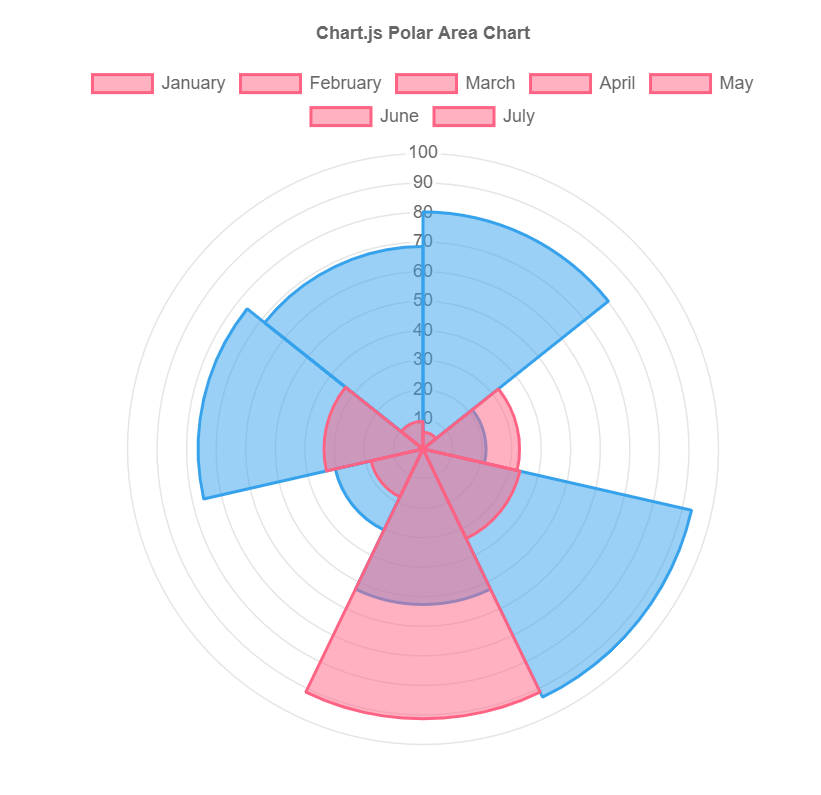
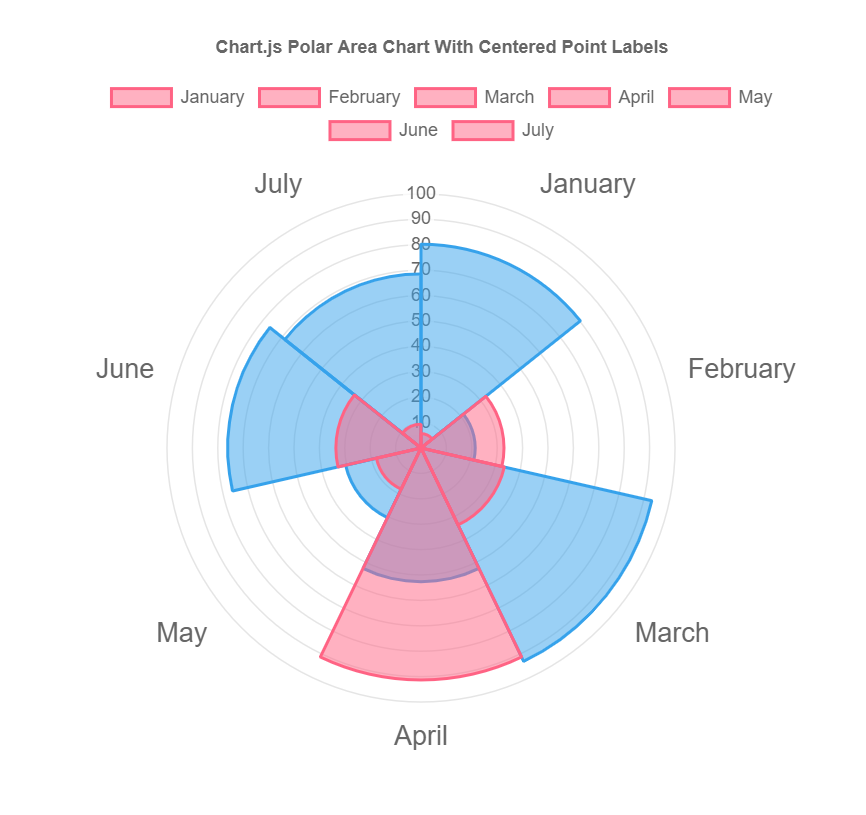
labels: ["January", "February", "March", "April", "May", "June", "July"],
datasets: [
{
label: "Dataset 1",
data: [
5.64900549, 32.6611797, 33.64454733, 91.31515775, 18.01868999,
33.50823045, 9.38871742
],
borderColor: "rgb(255, 99, 132)",
backgroundColor: "rgba(255, 99, 132, 0.5)"
},
{
label: "Dataset 2",
data: [
80.22805213, 21.33487654, 93.20301783, 52.62259945, 30.45781893,
76.09139232, 68.53566529
],
borderColor: "rgb(54, 162, 235)",
backgroundColor: "rgba(54, 162, 235, 0.5)"
}
]
}