Custom Tooltip
tip
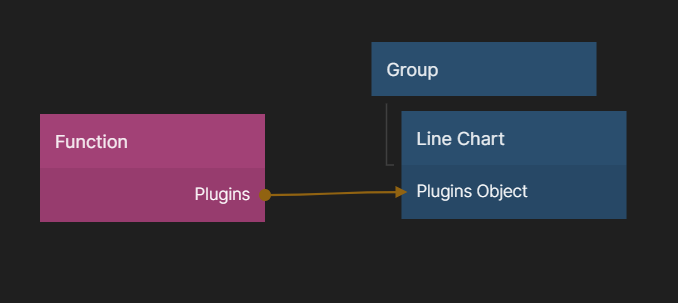
There are some known timing problems when setting Plugins Object,
solution is to set the Plugins Object on Did Mount.
Custom Tooltip Content
This sample shows how to use the tooltip callbacks to add additional content to the tooltip. Chart.js Example
Outputs.Plugins = {
  tooltip: {
    callbacks: {
      footer: (tooltipItems) => {
        let sum = 0;

        tooltipItems.forEach(function (tooltipItem) {
          sum += tooltipItem.parsed.y;
        });
        return "Sum: " + sum;
      },
    },
  },
};
External HTML Tooltip
This sample shows how to use the external tooltip functionality to generate an HTML tooltip. Chart.js Example
const getOrCreateTooltip = (chart) => {
  let tooltipEl = chart.canvas.parentNode.querySelector("div");

  if (!tooltipEl) {
    tooltipEl = document.createElement("div");
    tooltipEl.style.background = "rgba(0, 0, 0, 0.7)";
    tooltipEl.style.borderRadius = "3px";
    tooltipEl.style.color = "white";
    tooltipEl.style.opacity = 1;
    tooltipEl.style.pointerEvents = "none";
    tooltipEl.style.position = "absolute";
    tooltipEl.style.transform = "translate(-50%, 0)";
    tooltipEl.style.transition = "all .1s ease";

    const table = document.createElement("table");
    table.style.margin = "0px";

    tooltipEl.appendChild(table);
    chart.canvas.parentNode.appendChild(tooltipEl);
  }

  return tooltipEl;
};

const externalTooltipHandler = (context) => {
  // Tooltip Element
  const { chart, tooltip } = context;
  const tooltipEl = getOrCreateTooltip(chart);

  // Hide if no tooltip
  if (tooltip.opacity === 0) {
    tooltipEl.style.opacity = 0;
    return;
  }

  // Set Text
  if (tooltip.body) {
    const titleLines = tooltip.title || [];
    const bodyLines = tooltip.body.map((b) => b.lines);

    const tableHead = document.createElement("thead");

    titleLines.forEach((title) => {
      const tr = document.createElement("tr");
      tr.style.borderWidth = 0;

      const th = document.createElement("th");
      th.style.borderWidth = 0;
      const text = document.createTextNode(title);

      th.appendChild(text);
      tr.appendChild(th);
      tableHead.appendChild(tr);
    });

    const tableBody = document.createElement("tbody");
    bodyLines.forEach((body, i) => {
      const colors = tooltip.labelColors[i];

      const span = document.createElement("span");
      span.style.background = colors.backgroundColor;
      span.style.borderColor = colors.borderColor;
      span.style.borderWidth = "2px";
      span.style.marginRight = "10px";
      span.style.height = "10px";
      span.style.width = "10px";
      span.style.display = "inline-block";

      const tr = document.createElement("tr");
      tr.style.backgroundColor = "inherit";
      tr.style.borderWidth = 0;

      const td = document.createElement("td");
      td.style.borderWidth = 0;

      const text = document.createTextNode(body);

      td.appendChild(span);
      td.appendChild(text);
      tr.appendChild(td);
      tableBody.appendChild(tr);
    });

    const tableRoot = tooltipEl.querySelector("table");

    // Remove old children
    while (tableRoot.firstChild) {
      tableRoot.firstChild.remove();
    }

    // Add new children
    tableRoot.appendChild(tableHead);
    tableRoot.appendChild(tableBody);
  }

  const { offsetLeft: positionX, offsetTop: positionY } = chart.canvas;

  // Display, position, and set styles for font
  tooltipEl.style.opacity = 1;
  tooltipEl.style.left = positionX + tooltip.caretX + "px";
  tooltipEl.style.top = positionY + tooltip.caretY + "px";
  tooltipEl.style.font = tooltip.options.bodyFont.string;
  tooltipEl.style.padding =
    tooltip.options.padding + "px " + tooltip.options.padding + "px";
};

Outputs.Plugins = {
  tooltip: {
    enabled: false,
    position: "nearest",
    external: externalTooltipHandler,
  },
};
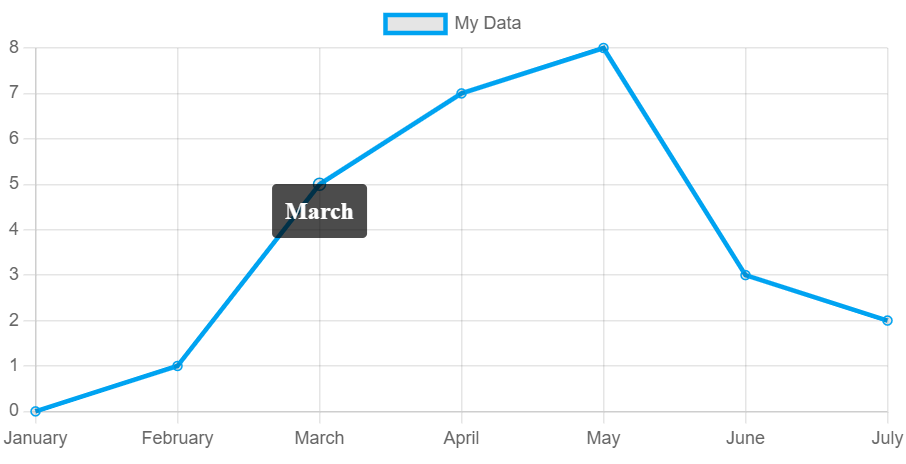
Only show titles
For this we just change the code to only return the titles.
const getOrCreateTooltip = (chart) => {
  let tooltipEl = chart.canvas.parentNode.querySelector("div");

  if (!tooltipEl) {
    tooltipEl = document.createElement("div");
    tooltipEl.style.background = "rgba(0, 0, 0, 0.7)";
    tooltipEl.style.borderRadius = "3px";
    tooltipEl.style.color = "white";
    tooltipEl.style.opacity = 1;
    tooltipEl.style.pointerEvents = "none";
    tooltipEl.style.position = "absolute";
    tooltipEl.style.transform = "translate(-50%, 0)";
    tooltipEl.style.transition = "all .1s ease";

    const table = document.createElement("table");
    table.style.margin = "0px";

    tooltipEl.appendChild(table);
    chart.canvas.parentNode.appendChild(tooltipEl);
  }

  return tooltipEl;
};

const externalTooltipHandler = (context) => {
  // Tooltip Element
  const { chart, tooltip } = context;
  const tooltipEl = getOrCreateTooltip(chart);

  // Hide if no tooltip
  if (tooltip.opacity === 0) {
    tooltipEl.style.opacity = 0;
    return;
  }

  // Set Text
  if (tooltip.body) {
    const titleLines = tooltip.title || [];
    const bodyLines = tooltip.body.map((b) => b.lines);

    const tableHead = document.createElement("thead");

    titleLines.forEach((title) => {
      const tr = document.createElement("tr");
      tr.style.borderWidth = 0;

      const th = document.createElement("th");
      th.style.borderWidth = 0;
      const text = document.createTextNode(title);

      th.appendChild(text);
      tr.appendChild(th);
      tableHead.appendChild(tr);
    });

    const tableRoot = tooltipEl.querySelector("table");

    // Remove old children
    while (tableRoot.firstChild) {
      tableRoot.firstChild.remove();
    }

    // Add new children
    tableRoot.appendChild(tableHead);
  }

  const { offsetLeft: positionX, offsetTop: positionY } = chart.canvas;

  // Display, position, and set styles for font
  tooltipEl.style.opacity = 1;
  tooltipEl.style.left = positionX + tooltip.caretX + "px";
  tooltipEl.style.top = positionY + tooltip.caretY + "px";
  tooltipEl.style.font = tooltip.options.bodyFont.string;
  tooltipEl.style.padding =
    tooltip.options.padding + "px " + tooltip.options.padding + "px";
};

Outputs.Plugins = {
  tooltip: {
    enabled: false,
    position: "nearest",
    external: externalTooltipHandler,
  },
};