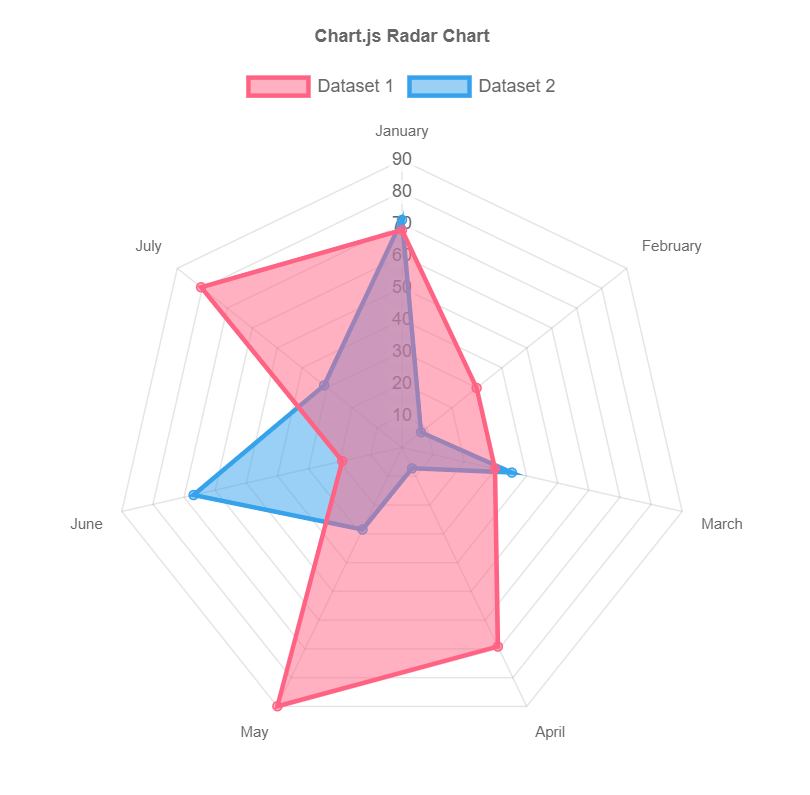
Outputs.Data = {
    labels: ["January", "February", "March", "April", "May", "June", "July"],
    datasets: [
        {
            label: "Dataset 1",
            data: [
                68.09585048, 29.88168724, 29.83624829, 69.19410151, 89.93055556,
                19.20610425, 80.47753772
            ],
            borderColor: "rgb(255, 99, 132)",
            backgroundColor: "rgba(255, 99, 132, 0.5)"
        },
        {
            label: "Dataset 2",
            data: [
                71.27572016, 7.65003429, 35.27949246, 7.2505144, 28.50137174,
                66.93329904, 31.1882716
            ],
            borderColor: "rgb(54, 162, 235)",
            backgroundColor: "rgba(54, 162, 235, 0.5)"
        }
    ]
}