Interactions
This guide is based on the documentation from Chart.js, which can be found here.
Converting Events to Data Values
A common occurrence is taking an event, such as a click, and finding the data coordinates on the chart where the event occurred. Chart.js provides helpers that make this a straightforward process.
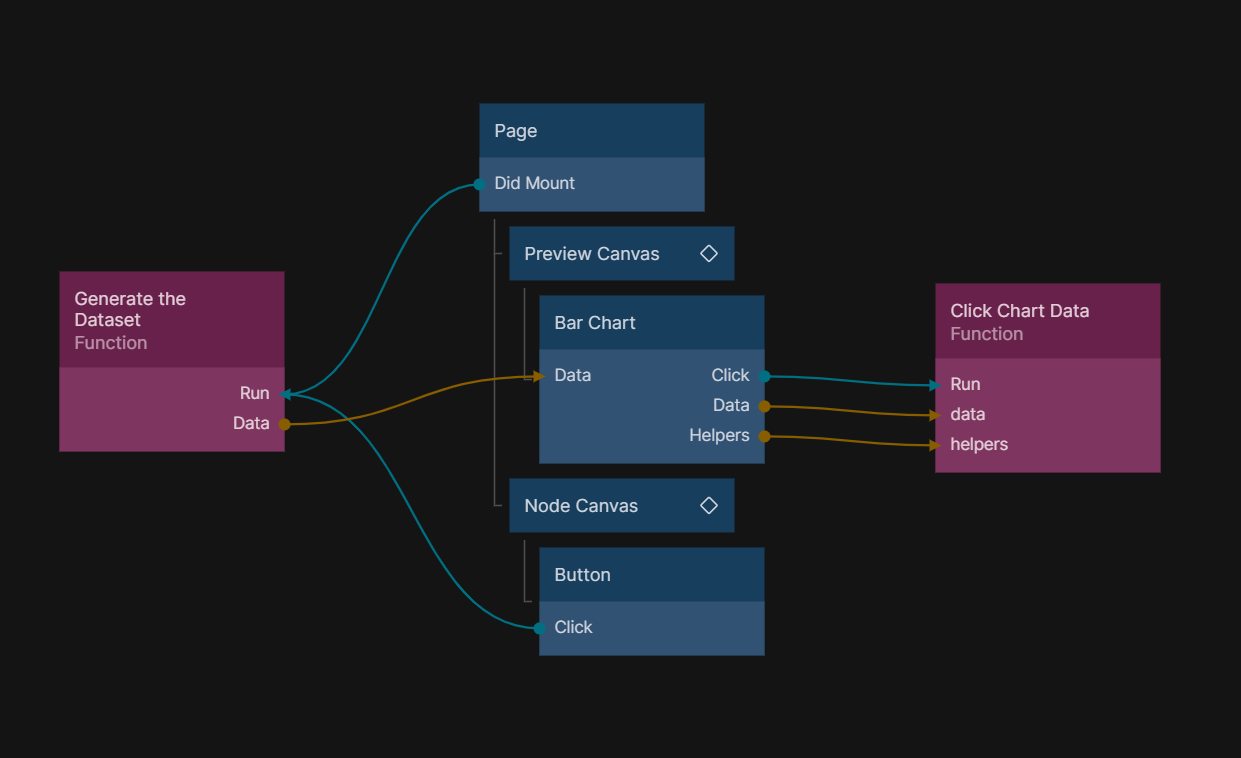
In this screenshot, we connect the "Click", "Data" and "Helpers" outputs to a function node to be able to process the chart data.
With this code in the Function node, we can start by getting the values on the X and Y axis.
const data = Inputs.data;
const helpers = Inputs.helpers;

const canvasPosition = helpers.getRelativePosition(data, data.chart);

// Substitute the appropriate scale IDs
const dataX = data.chart.scales.x.getValueForPixel(canvasPosition.x);
const dataY = data.chart.scales.y.getValueForPixel(canvasPosition.y);
Now with dataX and dataY we know what values the user clicked on.
To continue from here, you can follow Chart.js guides.
There are for examples getPixelForValue, that returns the location of the given data point.
Before Event
Make all the connections under the "Before Event" category and helpers from the "Click Event" category, and this function will be triggered on any of the before events.
const chart = Inputs.chart;
const args = Inputs.args;
const helpers = Inputs.helpers;

const canvasPosition = helpers.getRelativePosition(args.event, chart);

// Substitute the appropriate scale IDs
const dataX = chart.scales.x.getValueForPixel(canvasPosition.x);
const dataY = chart.scales.y.getValueForPixel(canvasPosition.y);

console.log({
  canvasPosition,
  dataX,
  dataY,
});