Line Chart Example
Basic
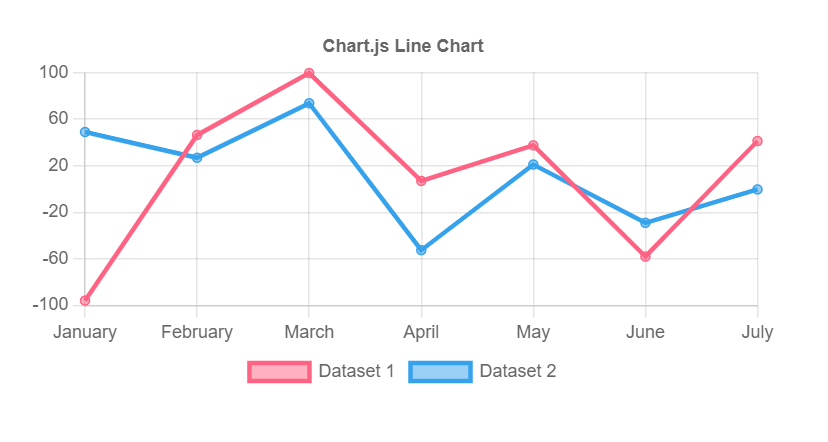
Outputs.Data = {
    labels: ["January", "February", "March", "April", "May", "June", "July"],
    datasets: [
        {
            label: "Dataset 1",
            data: [
                -95.88820302, 46.40775034, 99.6090535, 6.92558299, 37.49314129,
                -58.07098765, 41.22085048
            ],
            borderColor: "rgb(255, 99, 132)",
            backgroundColor: "rgba(255, 99, 132, 0.5)"
        },
        {
            label: "Dataset 2",
            data: [
                48.94890261, 26.84156379, 73.66426612, -52.55829904, 21.01337449,
                -29.07750343, -0.36179698
            ],
            borderColor: "rgb(54, 162, 235)",
            backgroundColor: "rgba(54, 162, 235, 0.5)"
        }
    ]
}
Change Interpolation modes
Outputs.Scales = {
    x: {
        display: true,
        title: {
            display: true
        }
    },
    y: {
        display: true,
        title: {
            display: true,
            text: 'Value'
        },
        suggestedMin: -10,
        suggestedMax: 200
    }
}